Figure 3.
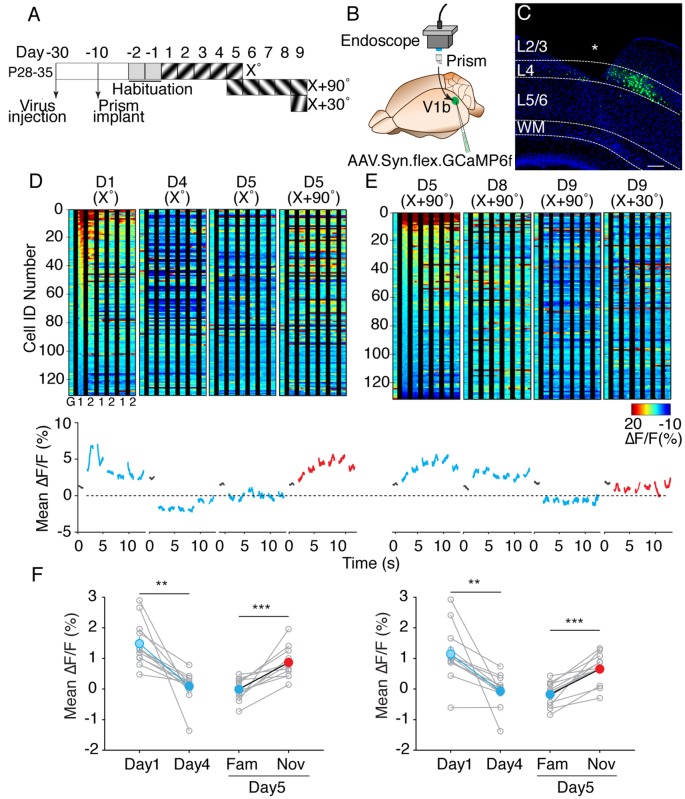
V1 layer 4 principal neurons show a decrease in calcium response magnitude to the familiar visual stimulus following SRP induction. (A) Timeline of experimental procedure and training paradigm. (B) Schematic of prism implantation in V1 and endoscopic imaging. (C) Confocal image of prism implanted Scnn1a mouse with GCaMP6f virus injection targeted to layer 4 principal neurons. Asterisk indicates a tract of prism. Scale bar, 100 μm. (D) Top: representative heat map of cellular calcium responses from all neurons from one animal across training days (D) to the presented visual stimulus orientation (°) as depicted in panel (A). G indicates gray screen, 1 indicates one phase-reversal of the visual stimulus and 2 indicates subsequent phase-reversal. Bottom: mean magnitude of calcium responses at each time point from the panel above. Gray traces indicate the presence of a gray screen. (E) Same analyses as performed in Figure 3D. Cell IDs are reordered in descending order of activity in response to X + 90° on day 5. (F) Left panel: mean magnitude of calcium responses of all imaged neurons (n = 1,842) from all animals (n = 12) during the 50–1,200 ms period following onset and subsequent phase reversals of the visual stimulus. There is an overall decrease in the mean magnitude of calcium response between day 1 and day 4 (Paired t-test, p = 0.001). Mean Ca2+ response on day 5 to the familiar visual stimulus is also significantly reduced compared to the mean response to the novel visual stimulus (Paired t-test, p = 0.0003). Right panel: mean magnitude of Ca2+ responses of all recorded neurons from all animals during the 50–150 ms period following onset and subsequent phase reversals of the visual stimulus. Mean magnitude comparison between day 1 and day 4 is significant (Paired t-test, p = 0.003). Day 5 familiar and novel comparison is also significant (Paired t-test, p = 0.00004). Error bars indicate SEM. **p < 0.01, ***p < 0.001.

