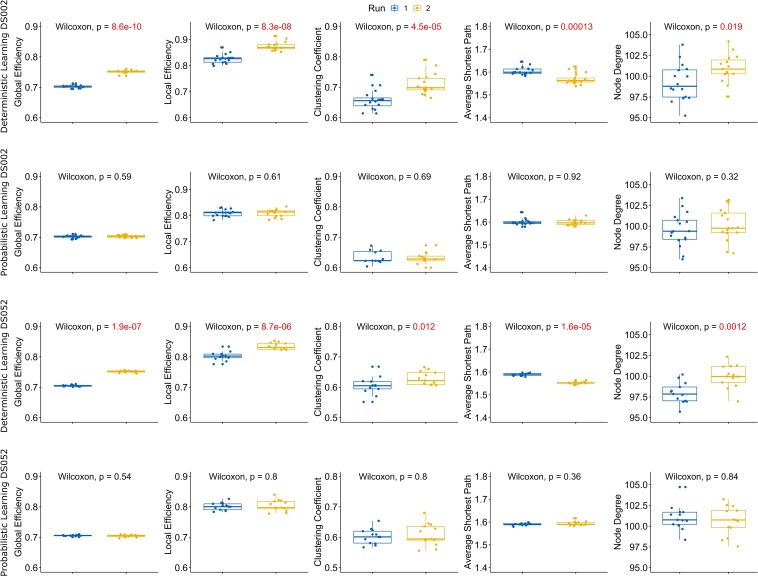
FIGURE 3.
Complex Network statistics for BN atlas. A complete overview of the complex network statistics (respectively, Global and Local Efficiency, Clustering Coefficient, Average Shortest Path Length and Node Degree see Table 3) computed on the functional connectomes for both datasets (ds002, ds052, rows 1–2 and 3–4 respectively) and both experimental conditions (deterministic/probabilistic) embedded in the Brainnetome atlas. Plots reported the statistical significance according to the Wilcoxon signed rank test with Bonferroni correction. Boxplot colors indicate the run: blue for run 1 and yellow for run 2. Significant p-values (<0.05) are highlighted in red.

