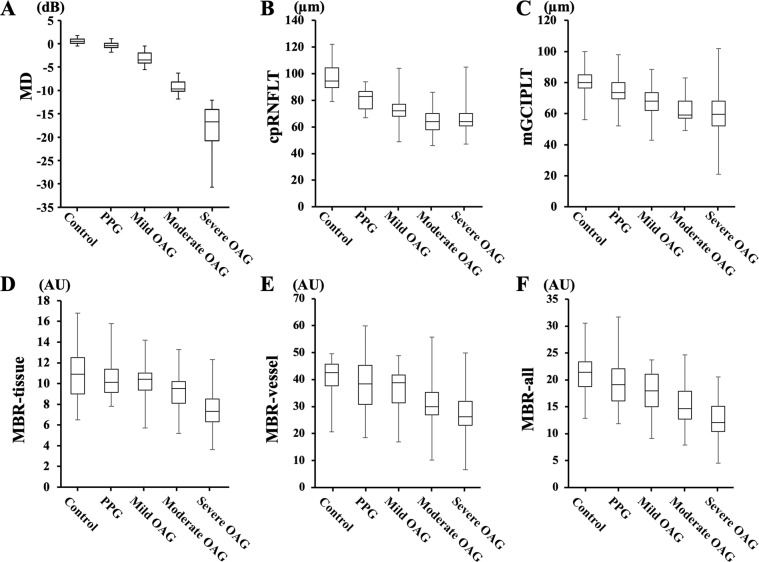
Figure 1.
Box-and-whisker plot showing differences in the mean deviations (A: MD), the circumpapillary retinal nerve fiber layer thickness (B: cpRNFLT), the ganglion cell layer plus inner plexiform layer thickness (C: mGCIPLT), and the mean blur rate (MBR)-tissue (D), MBR-vessel (E), and MBR-all (F). The bottom and top of the box are the first and third quartiles, and the band within the box is the median. The ends of the whiskers represent the minimum and maximum of all the data.

