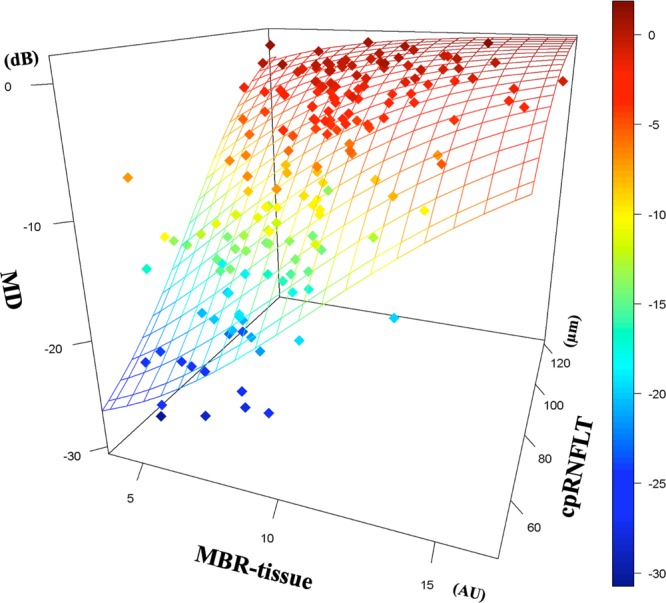
Figure 3.

Stepwise multiple logistic regression analyses of the relationships among the mean deviations (MD), the cpRNFLT, and the MBR-tissue. The MBR-tissue and the cpRNFLT were both significant factors markedly correlated with the MD of the visual fields (Odds ratio;1.25(1.03–1.52) and 1.07 (1.02–1.11), respectively). The best model was chosen on the basis of Akaike information criterion (AIC); MD = −30.73 + 32.61/{1 + e^(5.56989-0.06345cpRNFLT −0.22303 MBR-tissue)} (Table 4).
