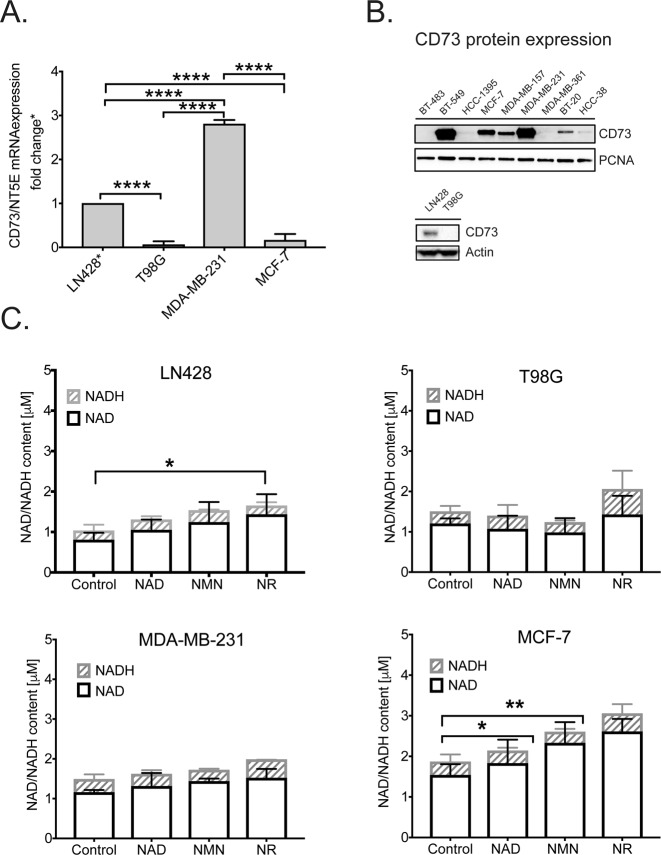
Figure 3.
Comparative analysis of CD73 expression in human cancer cell lines and its effect on NAD+ biosynthesis. (A) Measurement of mRNA expression for the CD73/NT5E gene in cancer cell lines, as determined by qRT-PCR analysis, normalized to the expression of human β-actin mRNA via the ∆∆CT method. (B) Immunoblot analysis of the expression of CD73 in nine breast cancer cell lines, including the MCF-7 and MDA-MB-231 cells used herein (top panel) and two glioma cell lines, including the LN428 and T98G cells used herein (bottom panel). PCNA was used as a loading control for the top panel and actin was used as a loading control for the bottom panel. See Supplement Fig. S2F for the expression of NRK1 in the breast cancer cell lines analyzed from the same cell lysates. (C) Total intracellular NAD levels (NAD+ and NADH) in each of the four cancer cell lines cultured in the presence of NAD+, NMN or NR (100 μM) for 24 hrs. Statistical analysis was performed using GraphPad Prism 7 and two-way ANOVA followed by post-hoc test with Tukey’s correction (ns = not significant, *p = 0.0419, **p = 0.0032).

