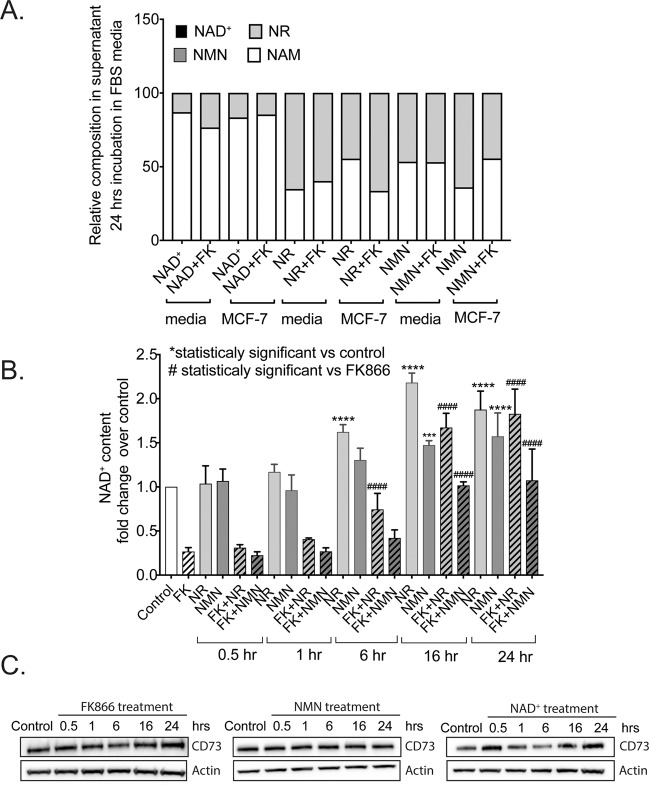
Figure 5.
Assessment of the time dependent changes of extracellular NAD+ and NAD+ metabolite composition and intracellular NAD+ levels following metabolite supplementation and/or NAMPT inhibition. (A) NMR analysis of the composition of NAD+/NAD+-metabolites in MCF-7 cell supernatants from cells exposed to NAD+ for 24 hrs. (B) Measurements of intracellular NAD+ content in MCF-7 cells exposed to NAD supplements (NMN and NR) and/or the NAMPT inhibitor, FK866, at different time points after supplement addition. Statistical analysis was performed using GraphPad Prism 7 - one-way ANOVA followed by post-hoc test with Tukey’s correction was used. (ns = not significant, ***p = 0.0004 or ****p < 0.0001) (C) Immunoblot analysis to evaluate changes in CD73 expression impacted by the treatment of MCF-7 cells with FK866 (30 nM), NMN (100 μM) or NAD+ (100 μM) for times ranging from 0.5 to 24 hrs, as compared to the untreated control, as indicated.

