
Figure 4.
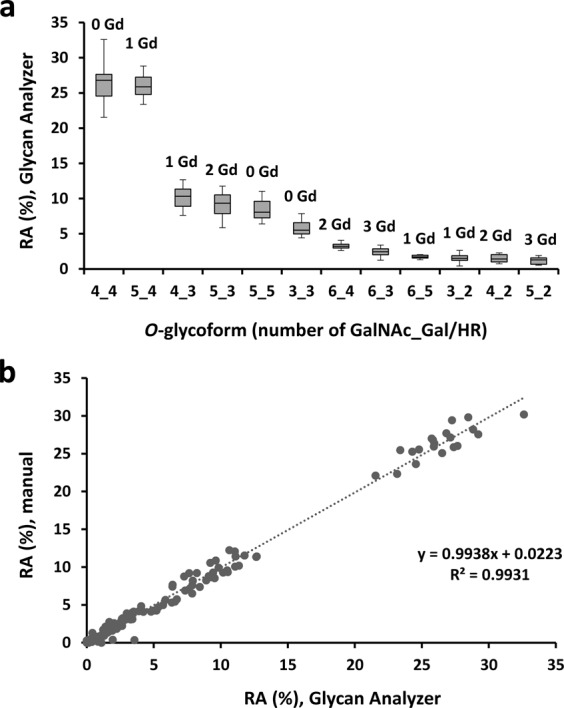
Relative abundance (RA) of various HR O-glycoforms in IgA1 isolated from sera of 10 healthy controls. (a) RA determined by using an automated program, Glycan Analyzer. RA of each O-glycopeptide is shown as a box plot with glycoforms on X axis in decreasing order of abundance. The number of attached GalNAc (x) and Gal (y) residues is notes as x_y on X axis. The number of Gd O-glycans in each O-glycopeptide is shown above the box. The upper and lower limits of the boxes represent the first and third quartiles of RA%. A segment inside the rectangle shows the median and the whiskers above and below the box show the minimum and maximum values. (b) Correlation between RA determined by Glycan Analyzer and by manual assessment. Linear regression analysis revealed a strong congruence between the two methods (y = 0.994x + 0.022, R² = 0.9931).