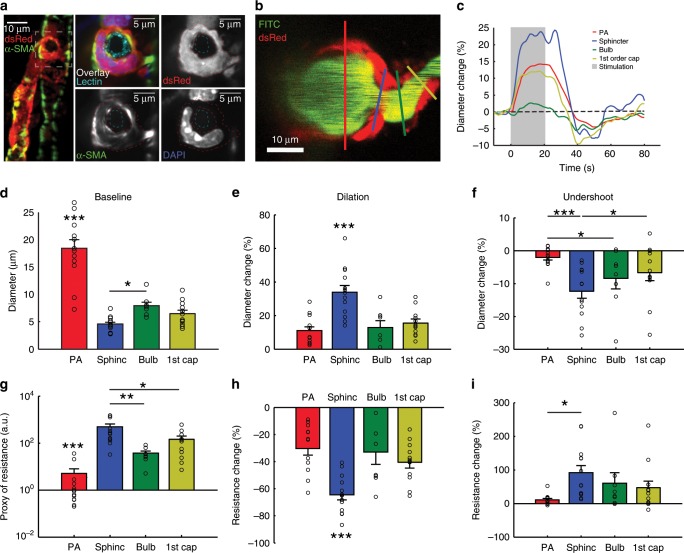
Fig. 3. Sphincters actively regulate blood flow.
a Ex vivo coronal slices of an FITC-lectin-stained NG2-dsRed mouse immunostained for α-SMA. Left panel: maximal projection of a PA with a precapillary sphincter at the first order capillary branch point. The marked area is shown on the right. Right panels: local maximal intensity projections of the precapillary sphincter region of dsRed, α-SMA, DAPI, or all channels including FITC-lectin overlaid. The lumen (cyan) and the outlines of the dsRed signal of the precapillary sphincter cell have been marked by dashed lines in the three grayscale images. b–i In vivo whisker pad stimulation experiments (anaesthetized NG2-dsRed mice) using maximal intensity projected 4D data obtained by two-photon microscopy, n = 13 mice for PA and sphincter, 8 for bulb and 12 for first order capillary, ±SEM. b Maximal intensity projection of a PA branch point where the colored lines indicate the ROIs for diameter measurements of the vessel segments: PA (red), precapillary sphincter (blue), bulb (green), and first order capillary (yellow). c Representative time series of relative diameter dynamics in each vessel segment upon 20 s of 5 Hz whisker pad stimulation (gray bar, start at time zero). d Summary of baseline diameters (absolute values). e Summary of peak diameter change upon whisker pad stimulation. f Summary of the peak undershoot phase after whisker pad stimulation. g A proxy of flow resistance at baseline estimated using Poiseuille’s law. h Relative change in flow resistance at peak dilation during stimulation. i Relative change in flow resistance during the poststimulation undershoot. The Kruskal–Wallis test was used in (d, g, and i) to reveal differences among vessel segments, followed by a Wilcoxon rank-sum test (with Holm’s p value adjustment) for pairwise comparisons. LME models were used in (e, f, h, and m) to test for differences among segments, followed by Tukey post hoc tests for pairwise comparisons. In each figure, significance codes *p < 0.05, **p < < 0.01, and ***p < 0.001. Source data are provided as a Source Data file.

