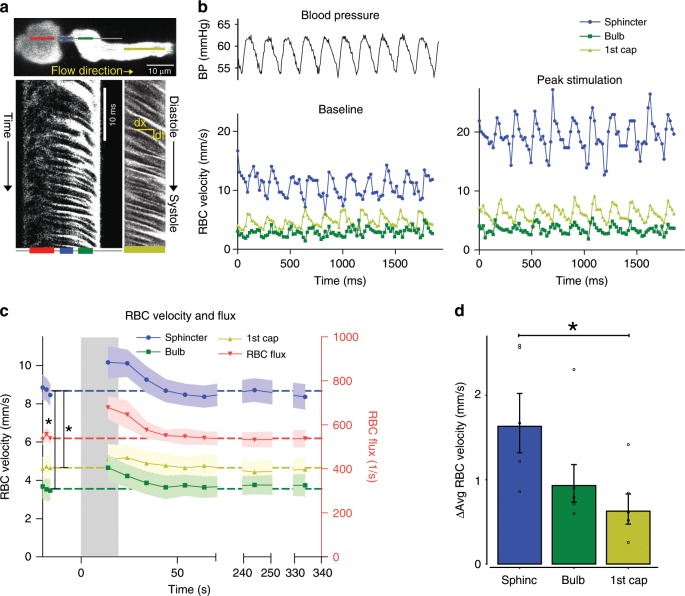
Fig. 4. Red blood cell velocity and flux at the sphincter.
a Resonance scanning allows for rapid repetitive line-scans in a single z-plane (upper panel). In the resulting space–time maps (lower panel), individual cells appear in black with an angle proportional to the cell velocity. Red, blue, green, and yellow lines indicate the regions of the line-scans derived from the PA, sphincter, bulb, and first order capillary (first order capillaries were mostly scanned in consecutive experiments). b Fluctuations in femoral artery blood pressure (left upper panel) and RBC velocity (left lower panel) correlated. During whisker pad stimulation (right panel), RBC velocity increased. c Time series of RBC velocities and flux during whisker pad stimulation. RBC velocity at the precapillary sphincter was significantly higher than the bulb and first order capillary at baseline and peaked around 10 s after stimulation before returning to baseline. d Summary of the difference between maximal and baseline RBC velocity during whisker stimulation. In d, the LME analysis was performed on log-transformed data to ensure homoscedasticity. n = 6 mice, ±SEM, significance code *p < 0.05. Source data are provided as a Source Data file.

