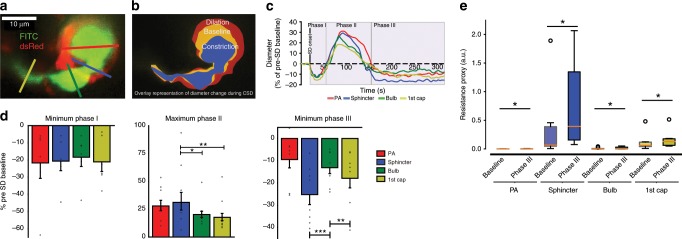
Fig. 6. Sphincters are vulnerable to cortical spreading depolarization.
Cortical spreading depolarization was elicited in the posterior part of the somatosensory cortex by microinjection of potassium acetate during imaging of the precapillary sphincter. a Representative maximal intensity projection of an FITC-dextran loaded NG2-dsRed mouse at a precapillary sphincter. Colored lines mark the ROIs for diameter measures. b Overlaid outlines of baseline (yellow), phase II dilation (red), and phase III constriction (blue). c Representative time series of diameter changes within vessel segments during the three phases of CSD. d Summaries of maximal diameter changes within vessel segments during phase I–III of the CSD. During phase II, the PA and sphincter dilated significantly more than the first order capillary. During phase III, the sphincter constricted significantly more than the PA and the bulb. Datasets were analyzed via LME models, followed by Tukey post hoc tests for pairwise comparisons (phase II data were log-transformed to ensure homoscedasticity). e Boxplot summary of the estimated flow resistances at vessel segments at baseline and during phase III of CSD. Paired Wilcoxon signed rank tests were used to establish the difference (p < 0.05) before and during CSD phase III. n = 6 mice for phase I, 9 mice for phase II and 8 mice for phase III, ±SEM. The box extends from the lower to upper quartile values of the data, with a line at the median. The whiskers extend from the box to show the range of the data. Flier points are those past the end of the whiskers. In each figure, significance codes *p < 0.05, **p < 0.01, and ***p < 0.001. Source data are provided as a Source Data file.

