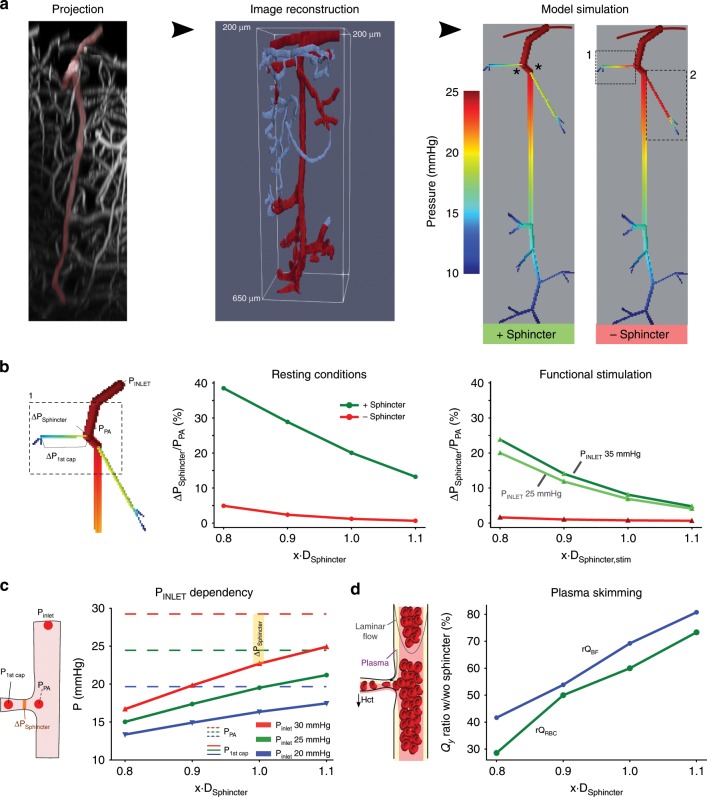
Fig. 7. Sphincters reduce pressure, flow, and hematocrit into capillaries.
a An xz-projection of a z-stack covering an entire PA (left) was reconstructed (middle) and converted into a computational model of a PA and associated first and second order capillaries. Model simulation (right) including the sphincters (green, marked by asterisks), or without the sphincters (red), observed in the two proximal branches along the PA gave rise to higly divergent pressure profiles along the first order capillaries (highlighted boxes in the model without sphincters). b Pressure drop across the sphincter depends on its diameter. Focusing on the first sphincter (left panel), the pressure drop across the sphincter (ΔPSphincter) relative to the pressure at the branch point (PPA) was calculated as a function of sphincter diameters (x∙DSphincter) under resting conditions (middle) or upon functional stimulation (right, using the relative changes in dilation from Fig. 3) with the sphincter (green curves) or without (red curves, where diameter of the sphincter is equal to the first order capillary). c The degree of sphincter contraction correlates to the pressure in the PA. With increasing inlet pressures into the PA (20 mmHg: blue, 25 mmHg: green, and 30 mmHg: red), the PA pressure increases (dashed curves) and the sphincter must contract to maintain a relatively low pressure into the first order capillary (full curves). The difference between the pressures in the PA and the first order capillary is the pressure drop across the sphincter (ΔPSphincter, see inset). d Flow reduction and phase separation effects due to the sphincter. The ratios of blood flow (rQBF, blue curve) and RBC flow (rQRBC, green curve) with and without the sphincter (rQwith_Sphincter/rQwithout_Sphincter) was calculated as a function of sphincter diameter. Both flows correlate proportionally with diameter but the RBC flow remains lower due to plasma skimming. Source data are provided as a Source Data file.

