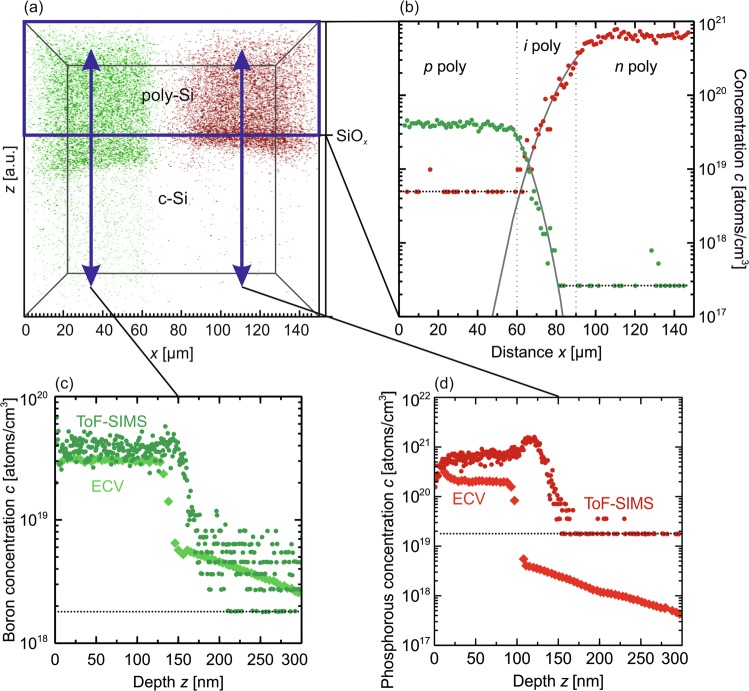
Figure 11.
ToF-SIMS analysis of a p(i)n structure in a solar cell. (a) 3d point diagram of the spatial resolved dopant concentrations of boron and phosphorous in a volume with an area of 140 × 140 µm2 and a depth of 314 nm. (b) Summed doping concentration over volume in Fig. 10a above a depth of 100 nm. The grey solid lines show exponential fits to the data in the formally intrinsic region to quantify the inter-diffusion. (c,d) Depth profiles of the boron and phosphorous concentration determined by ToF-SIMS and ECV measurements. The difference in position in z-direction of the decrease of the dopant concentrations need to be investigated further. The resolution limits of the different TOF-SIMS measurements are marked by black dotted lines.

