Figure 3.

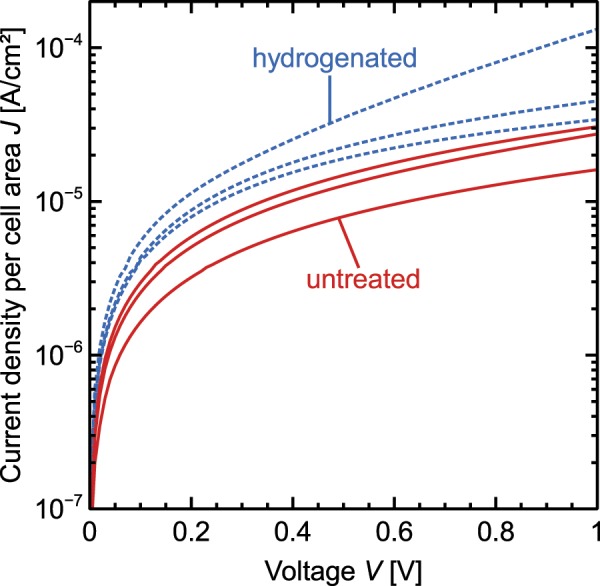
Dark-I-V-curves of p(i)n diode structures with a width of 50 µm of i-region. The dotted lines show results of hydrogenated samples and the solid lines show result of samples that have not received a hydrogen treatment.

Dark-I-V-curves of p(i)n diode structures with a width of 50 µm of i-region. The dotted lines show results of hydrogenated samples and the solid lines show result of samples that have not received a hydrogen treatment.