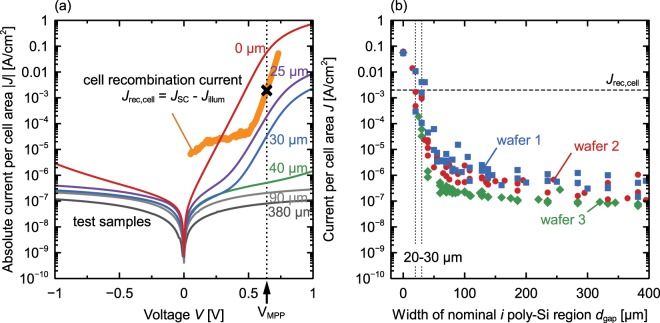
Figure 4.
J-V analysis of the p(i)n test structures. (a) J-V curves of p(i)n diodes with different width of the (i) poly-Si region. The MPP and Jrec refer to the record solar cell with an initially 30 µm-wide intrinsic region. (b) Current per cell area J through the p(i)n diodes at a voltage of 0.64 V (representative for the maximum power point of our solar cells) as a function of the designated width of the intrinsic region. The different colors indicate three identical test structures on different wafers.

