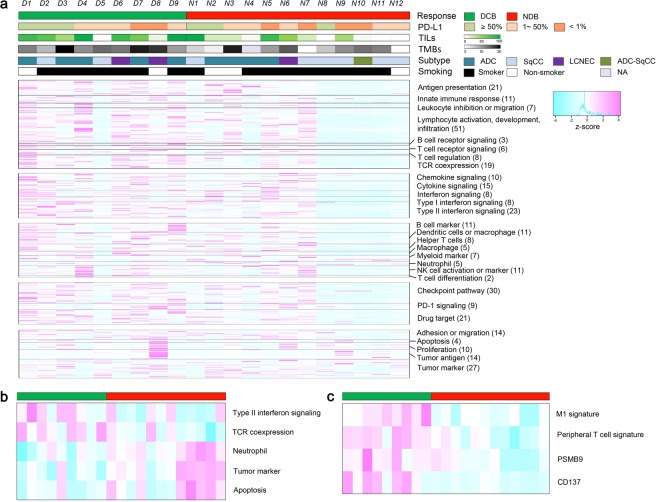
Figure 1.
Heatmap for the 395 immune-related genes from 21 patients. (a) Columns represent patients and rows genes. Expression levels have been aligned according to functional annotation groups. Categories of response (DCB, NDB), PD-L1 expression (≥50%,1–50%, <1%), smoking status (smoker, non-smoker) and histologic subtypes (adenocarcinoma, squamous cell carcinoma, large cell neuroendocrine carcinoma, adenosquamous cell carcinoma) are shown, and tumor infiltrating lymphocytes (TILs) and tumor mutation burden (TMB) are shown in continuous variables. (b) Heatmap for five signature scores of functional annotation groups discriminating DCB and NDB patients. (c) Heatmap for two gene signature scores and two genes that discriminate DCB and NDB patients.

