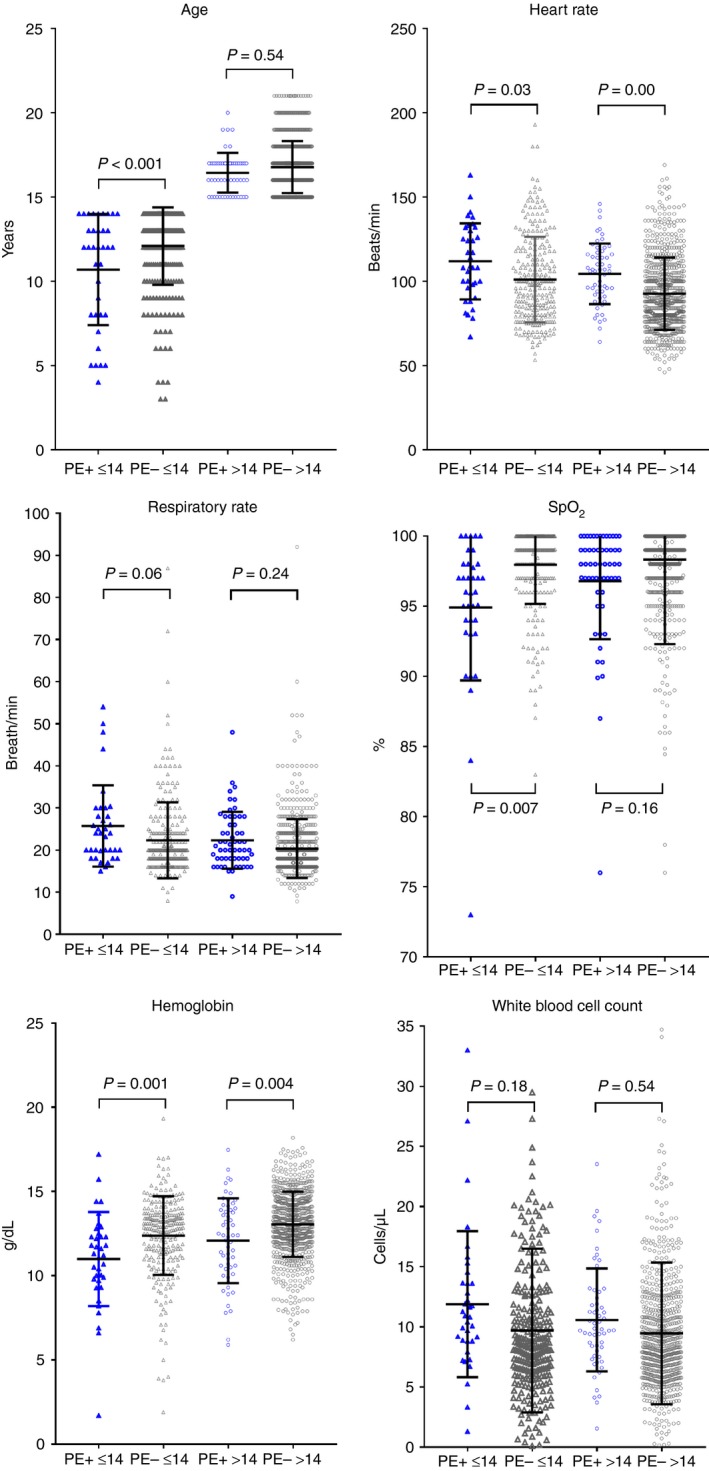
Figure 1.

Frequency (dot‐plots) of continuous variables tested by logistic regression for each patient in the study, stratified on the x‐axis by age ≤ 14 years (leftward 2 plots) or > 14 years (rightward 2 plots) and by pulmonary embolism (PE+) diagnosis (blue symbols) vs. no PE diagnosis (PE–, gray symbols). The P values were calculated from the Tukey’s post hoc test following 1‐way analysis of variance. SpO2, Pulse oximetry (%)
