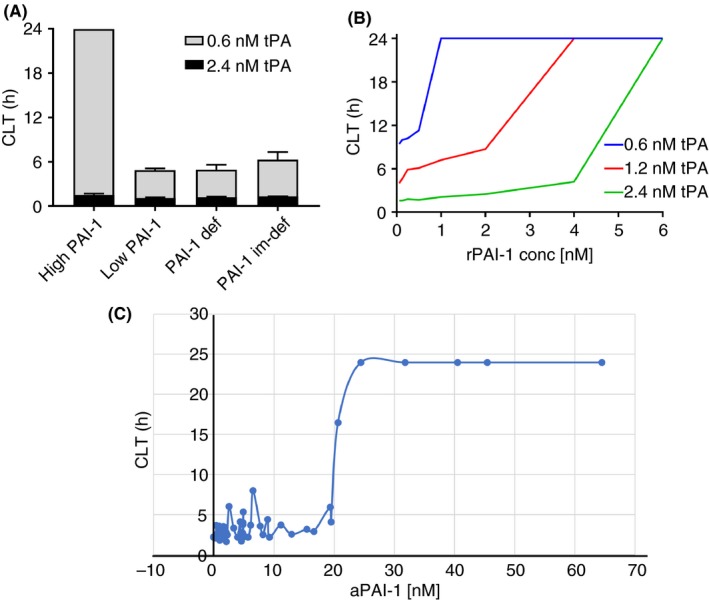
Figure 4.

Dependency of t‐PA resistance test on PAI‐1. (A) Low tPA concentration version of the assay differentiates samples with high (30nM) aPAI‐1 levels from samples with low or absence of PAI‐1. (B) Recombinant PAI‐1 is spiked in PAI‐1 immunodepleted plasma and clot lysis time is measured at 3 different t‐PA concentrations (0.6, 1.2, 2.4 nM). (C) Active PAI‐1 is measured by ELISA in 49 individuals and plotted against tPA resistance clot lysis time. The threshold effect in inhibition could be seen in individuals with 20‐25 nM of aPAI‐1. aPAI‐1, active form of plasminogen activator inhibitor 1; CLT, clot lysis time; rPAI‐1, recombinant plasminogen activator inhibitor 1; t‐PA, tissue‐type plasminogen activator
