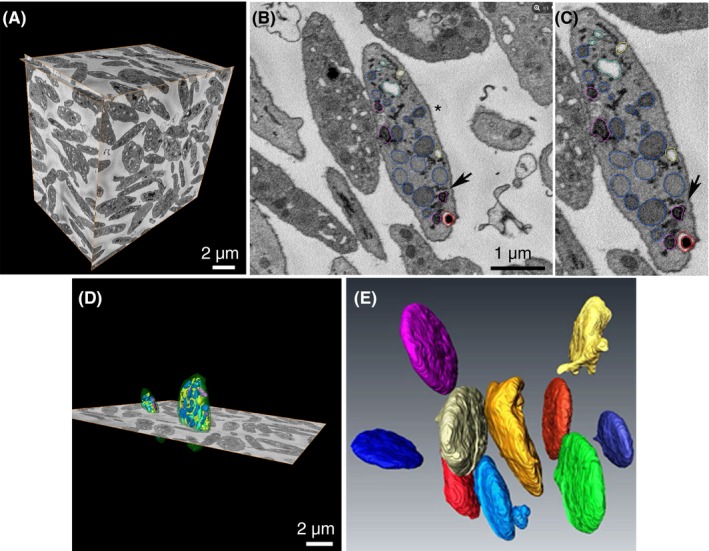
Figure 1.

SBF‐SEM of resting human platelets. (A) Three orthogonal slices delineate a complete Donor 1 data set. Multiple platelets can be seen in XY, XZ, and YZ planes. (B) Once validated for total inclusion within the image stack, individual platelets (**) were randomly chosen for segmentation analysis. (C) 1.33× magnification of B to illustrate segmented organelles and the color scheme used: α‐granules (blue), dense granules (red), dense cores (burgundy), mitochondria (magenta), open canalicular system (yellow), closed canalicular system (cyan). Black arrow in B and C points to area of close contact between dark DTS element and α‐granule. (D) Example of 2 platelet surfaces rendered in 3D together with one XY orthoslice. (E) Example surface renderings of 10 different Donor 1 platelets are shown in different colors and display a typical discoid shape, with few of the platelets displaying any pseudopods. Ten platelets each from Donors 2 and 3 were similarly identified, their organelles segmented, and surface rendered. DTS, dense tubular system; SBF‐SEM, serial block face–scanning electron microscopy
