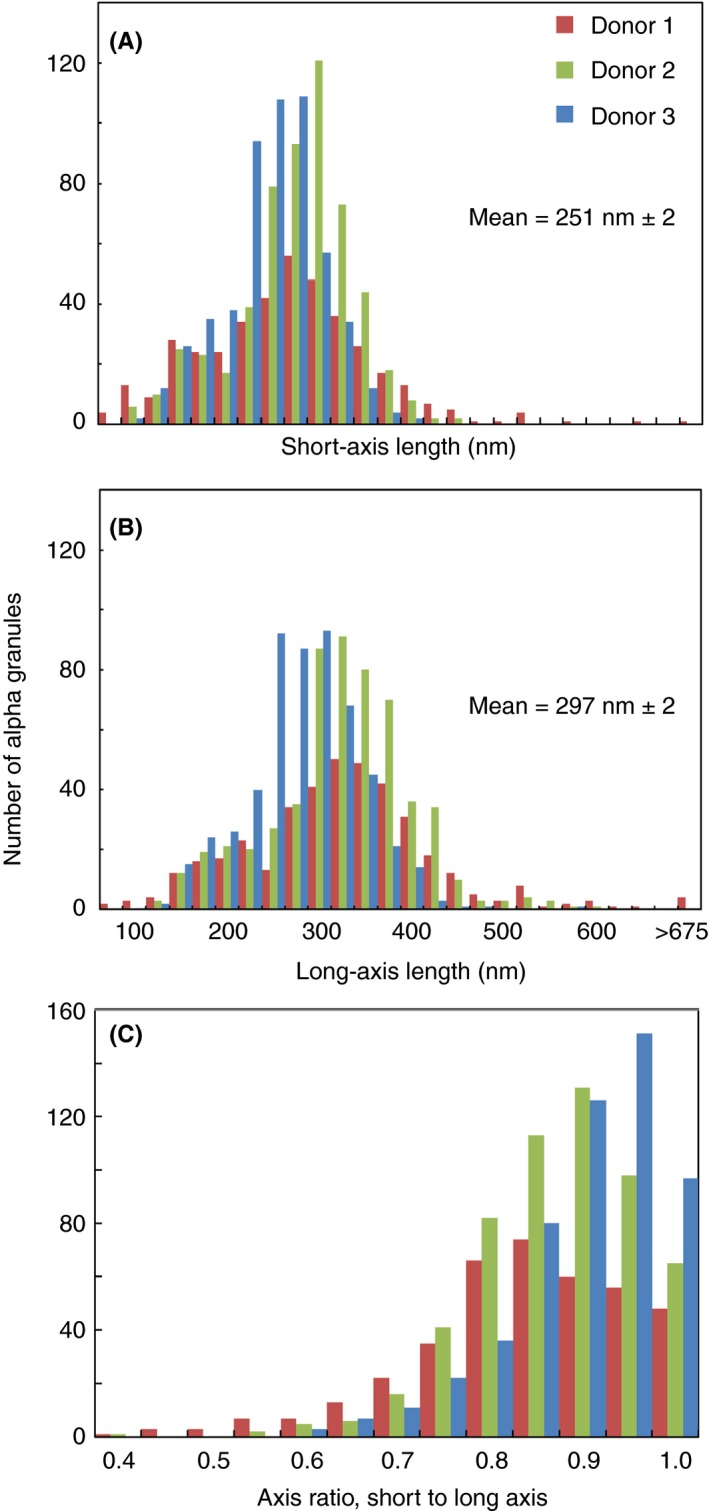
Figure 4.

Quantification of the axial shape parameters of 1488 α‐granules from 3 donors, 10 platelets each, revealed a single Gaussian population based on shape and size. Binned short‐axis (A) and long‐axis (B) lengths of each α‐granule for all 3 donors. The α‐granule axis ratio distribution (C) is calculated by dividing the width in A by the length in B and is a measure of the shape of the granules. In C, the x‐axis scale of 1 is defined as a perfect sphere and anything <1 is a spheroid. The short‐ and long‐axis lengths are calculated in Amira software by creating a “Custom Measure” in the “Label Analysis” module after using the “Connected Components” module to assign a unique material to each α‐granule in a platelet
