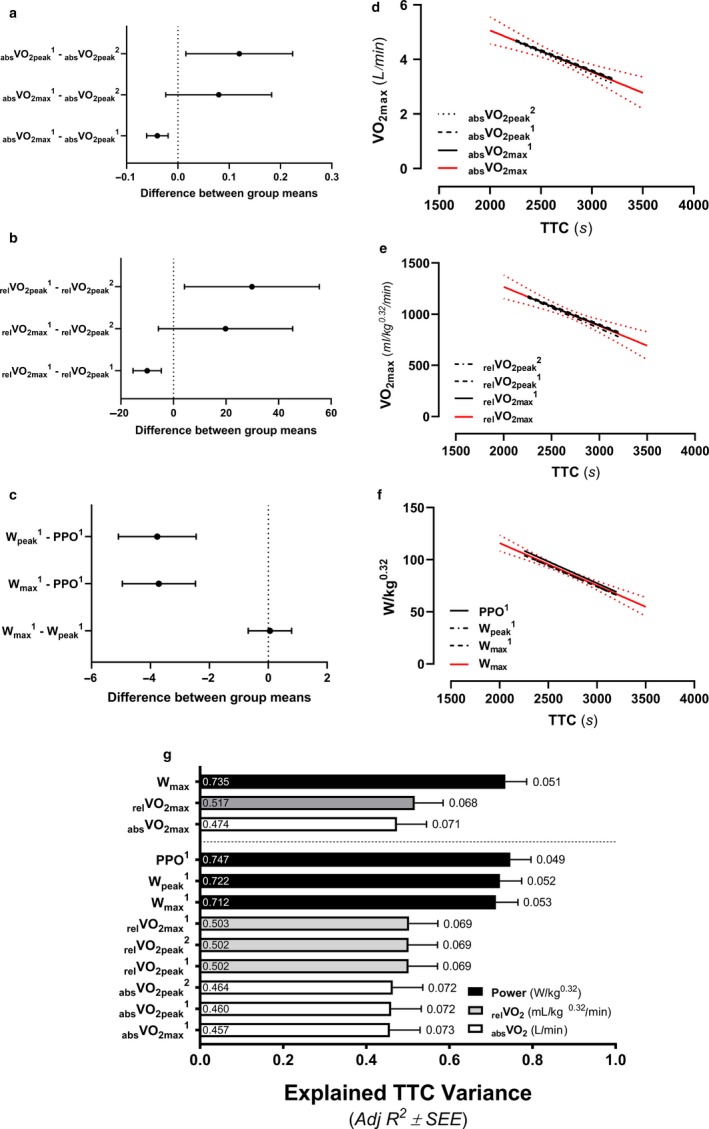
Figure 1.

Determination of the best measures for rates of whole‐body oxygen consumption (VO2) and power at maximal efforts in relation to endurance performance. The median difference and 95% confidence interval between methods for determining absolute (abs; L·min−1) VO2 (a), relative (rel; ml·min−1·kg−0.32) VO2 (b), and power (W·kg−0.32; c) at maximal efforts. The relationship between absVO2 (d), relVO2 (e), and power (f) in relation to 25‐km time trial time‐to‐completion (TTC). The red lines represent the respective averages of corresponding measures collected during exercise tests 1 (1) and 2 (2) and the dotted red line represents 95% confidence interval. Linear regression relationships between traditional variables collected at maximal efforts in relation to TTC (g). The labels within bars reports individual Adj R2 values representing explained variance and the labels outside of the error bars represents the standard error of the estimate (SEE) as a percent of the averaged group TTC (2,680.9 s). The highest but most stable (flattest slope) average VO2 across the greatest range of time was used to determine VO2max 1 with corresponding measures of Wmax 1 derived as the average power across that same range of time. Alternatively, VO2peak 1 & 2 were determined as the highest 30 s average VO2 throughout each respective exercise test with Wpeak 1 values reflecting average measures of power output across that same range of time. Peak power output (PPO1) was determined as the power output at the point of exhaustion for exercise test 1
