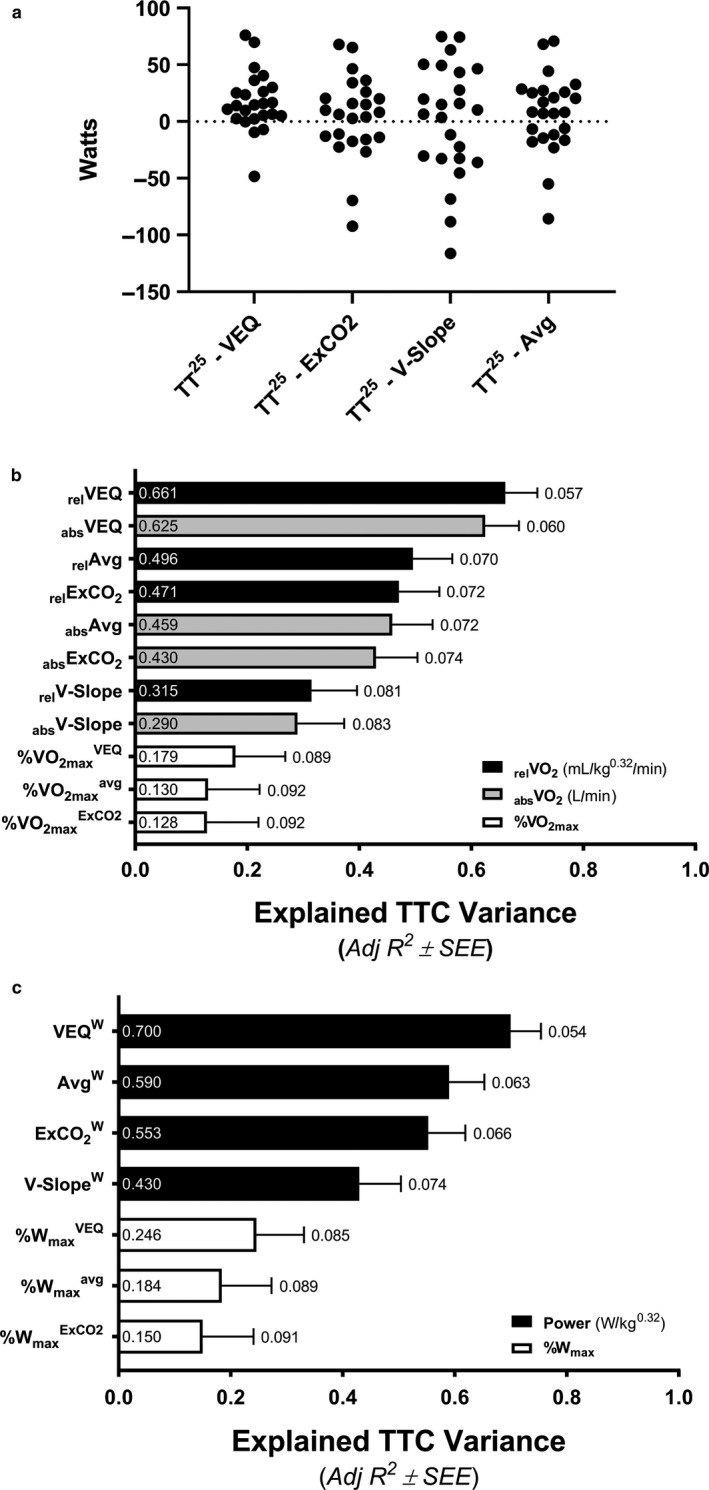
Figure 2.

Determination of the best methodology used to identify values at fatigue threshold in relation to human endurance performance. Individual differences between power determined using the ventilatory equivalents (VEQ), excess carbon dioxide (ExCO2), modified V‐slope (V‐Slope), ventilatory threshold average (Avg; average of VEQ, ExCO2, and V‐Slope values) methods and average 25‐km time trial (TT25) power output (a). Linear regression relationships between TT25 time‐to‐completion (TTC) and traditional variables representing rates of oxygen consumption (VO2; b) or power (c) at fatigue thresholds identified through different methods. The labels within bars reports individual Adj R2 values representing explained variance and the labels outside of the error bars represents the standard error of the estimate (SEE) as a percent of the averaged group TTC (2,680.9 s)
