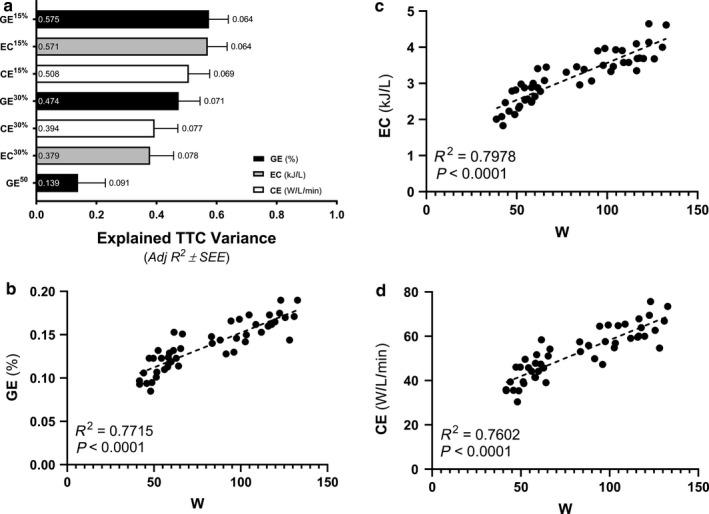
Figure 3.

Determination of the best indices of cycling efficiency in relation to human endurance performance. Linear regression relationships between 25‐km time‐to‐completion (TTC) and traditional variables representing gross efficiency (GE), exercise economy (EC), and cycling economy (CE) at 50 W (50), 15%, or 30% of power output at the point of exhaustion for exercise test 1 (a). The labels within bars reports individual Adj R 2 values representing explained variance and the labels outside of the error bars represents the standard error of the estimate (SEE) as a percent of the averaged group TTC (2,680.9 s). Indices of exercise efficiency, including GE (b), EC (c), and CE (d), all improved in relation to higher cycling workloads during exercise test 2
