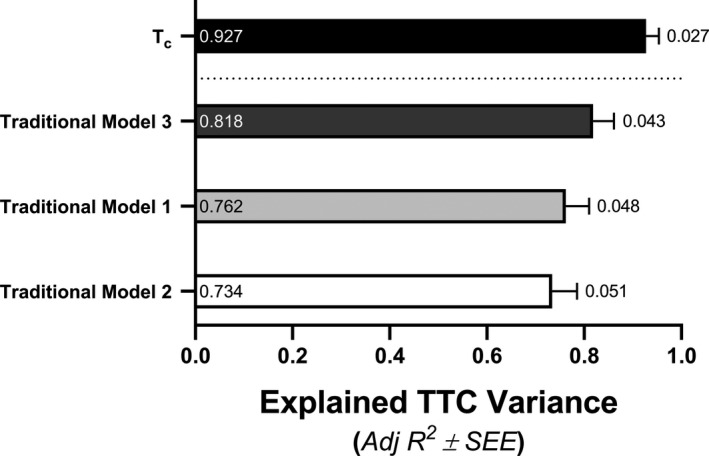
Figure 5.

Linear regression models determined via forward regression analyses in relation to 25‐km time‐to‐completion (TTC). The labels within bars reports individual Adj R 2 values representing explained variance and the labels outside of the error bars represents the standard error of the estimate (SEE) as a percent of the averaged group TTC (2,680.9 s). The time constant for the recovery of skeletal muscle oxygen consumption (Tc); Traditional regression models 1, 2, and 3 are defined in the Results section under the section entitled, Regression modeling to explain cycling endurance performance
