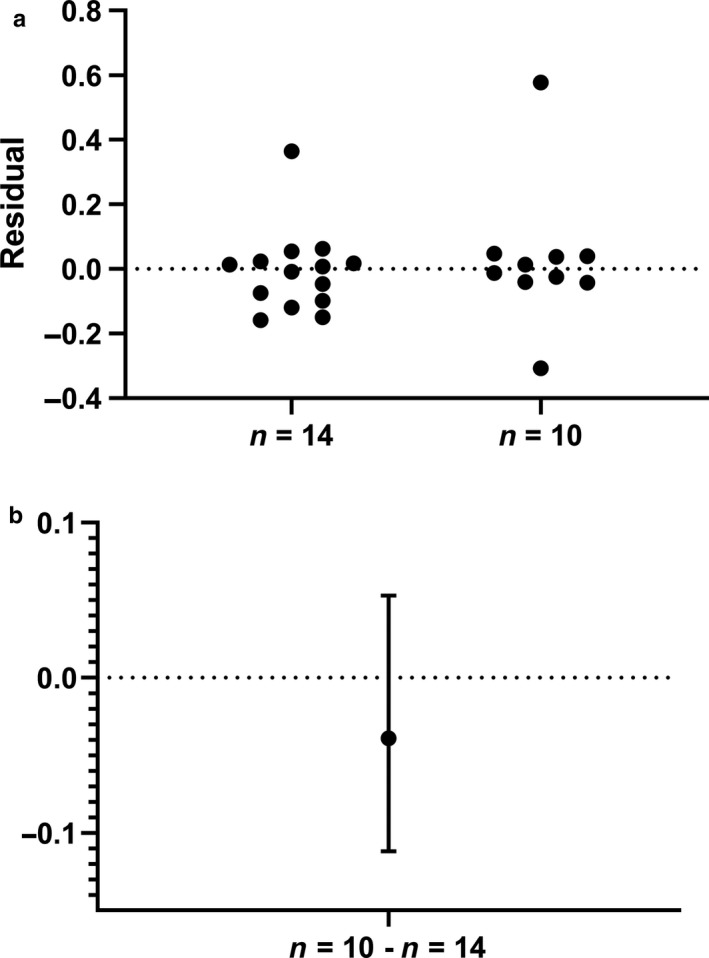
Figure 7.

Comparison of the power ratio, defined as the average 25‐km time trial power to individual fatigue threshold power identified using the ventilatory equivalents method, in the fastest (n = 14) versus the slowest (n = 10) study participants. Residuals from the Mann–Whitney test are plotted in a whereas the median difference and 95% confidence interval is shown in b
