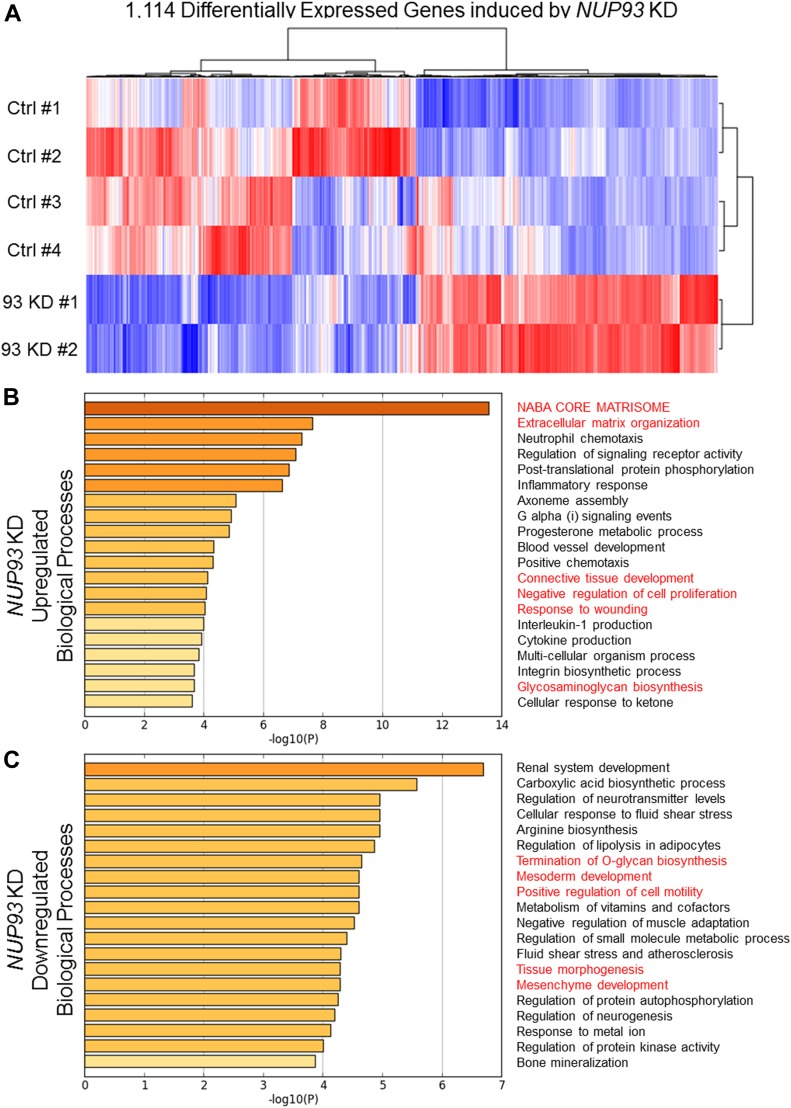
Figure 3. NUP93 KD dysregulates ECM organization, synthesis of glycocalyx proteins, cell motility, and cell proliferation within MDA-MB-231 BCCs.
(A) Heat map of 1,114 significant DE protein-coding genes. RNAseq raw counts were normalized to library depth as cpm. The values were then log-transformed, z-scaled, and hierarchically clustered for heat map visualization. blue = low, red = high (z-score = ±2). (B, C) Gene ontology analysis of up-regulated (B) and down-regulated (C) biological processes associated with NUP93 KD. Analysis performed with Metascape software.

