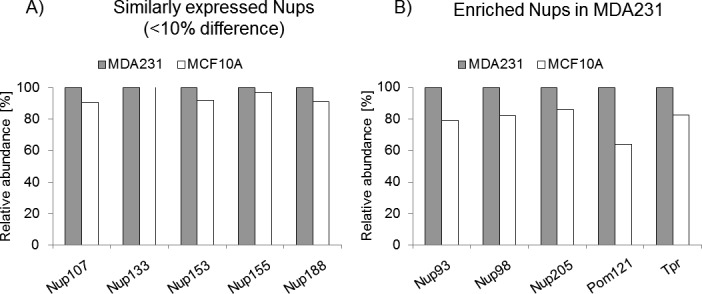
Figure S13. Mass spec analysis of nucleoporins.

(A, B) Mass spec analysis showing up-regulation of a subset of nucleoporins in MDA-MB-231 BCCs compared with normal breast epithelial cells MCF10A (A, B) (data were normalized and corrected from a Tandem Mass Tag dataset including MDA-MB-231 BCCs, MCF10A non-tumorigenic breast epithelial cells, H1299 non–small cell lung cancer cells and BEAS2B normal lung epithelial cells. Data from BEAS2B were discarded because of incomplete protein coverage. The remaining data were normalized and the relative intensity of MDA-MB-231 and MCF10A was plotted). Raw data are reported in Supplemental Data 1 (4.5MB, xlsx) .
