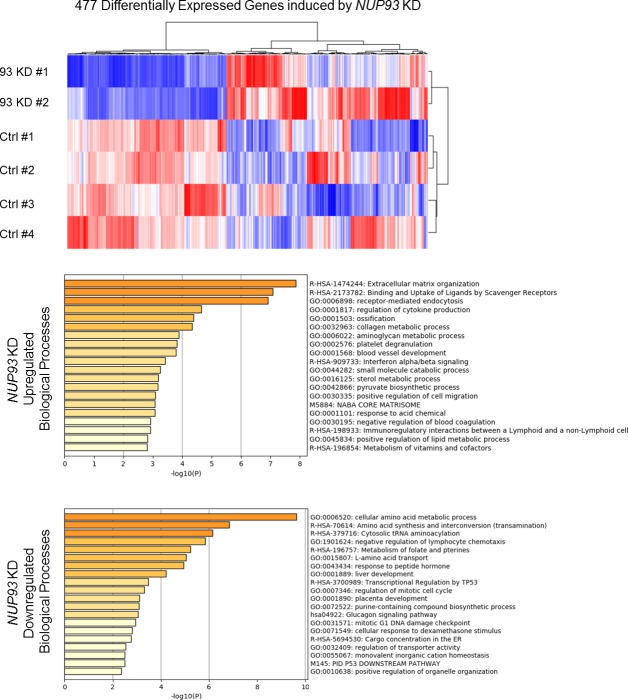
Figure S7. NUP93 KD effect on non–small cell lung cancer cells H1299.
Heat map of 477 significant DE protein-coding genes. RNAseq raw counts were normalized to library depth as cpm. The values were then log-transformed, z-scaled, and hierarchical clustered for heat map visualization. blue = low, red = high (z-score = ±2).

