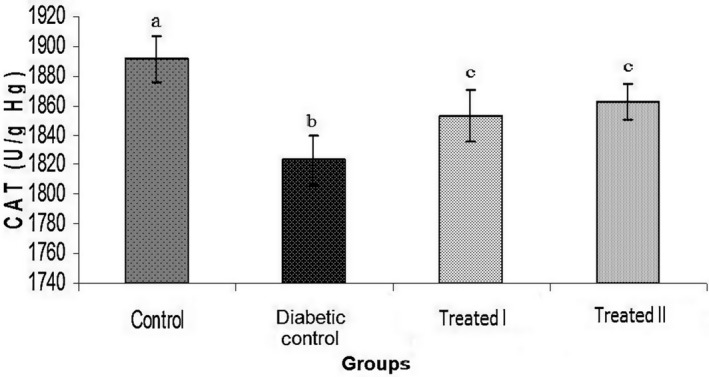
Figure 2.

Comparison of catalase (CAT) activity among different groups. Values represent the mean ± SEM in seven replications. Different alphabets show a significant difference with other groups (p < .05). Groups with a similar alphabet on each column are not significantly different, but different alphabets indicate a significant difference between groups
