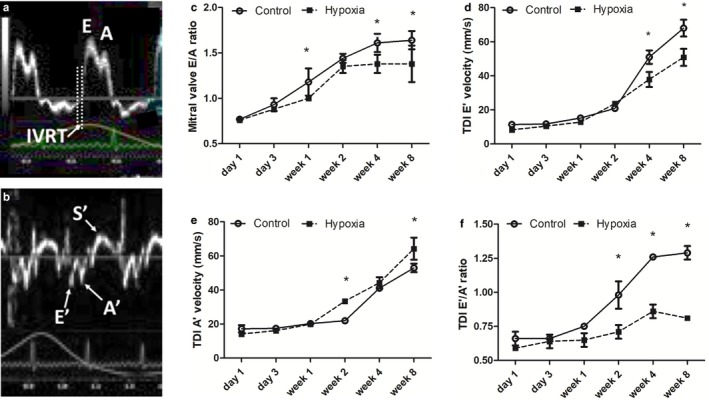
Figure 2.

Evolution of LV Inflow and tissue Doppler velocities in Prenatal Hypoxia versus Normoxia Pups. (a) and (b) demonstrate representative mitral valve inflow (upper) and tissue velocity (lower) Doppler tracings acquired in the rat pups. Graphs (c) through (f) demonstrate the evolution of the mitral valve E/A wave ratio and septal diastolic velocities in hypoxia and normoxia‐exposed pups. (c) Although the LV inflow E/A wave increased in both intrauterine hypoxia and normoxia‐exposed pups with age, this increase was significantly less in the former due to less of an increase in early filling velocities and a greater reliance on filling with atrial systole. (e) Early diastolic septal E’ velocity increased in both hypoxia‐exposed and control pups with age, but was significantly lower in hypoxia‐exposed pups by week 4 and week 8. (e) Late diastolic septal (A’) velocities also increased in both hypoxia‐exposed and control pups from day 1 to week 8 with statistically higher velocities at week 2 and week 8 in the former. (f) Septal E’/A’ wave ratios increased in both groups, but, as a consequence of less change in E’ and higher A’ velocities, were progressively lower in hypoxia‐exposed pups from week 2 onward. All data are presented as mean ± SE (*p < .008)
