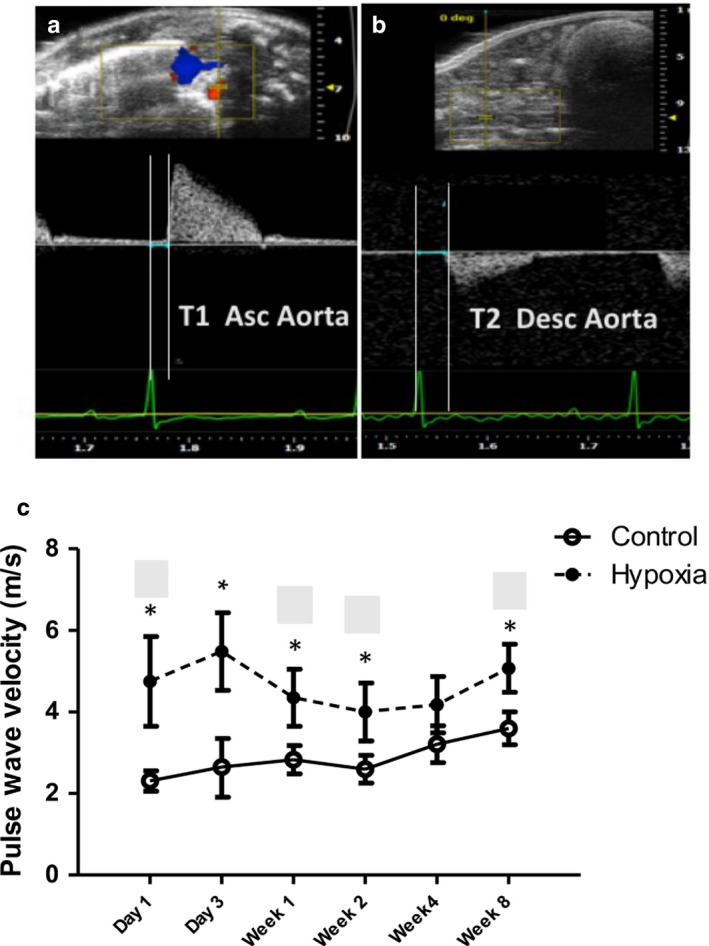
Figure 4.

Evolution of Aortic Pulse Wave Velocity in Prenatal Hypoxia versus Normoxia Pups. (a) and (b) demonstrate the technique of measuring T1 and T2 for the aortic pulse wave velocity at the ascending aorta and aortic bifurcation, respectively, as a measure of aortic stiffness. Both time intervals are measured from the onset of the QRS to the onset of flow. The aortic pulse wave velocity (PWV) was then calculated by the distance between the two points of measure divided by T2‐T1 in M/s. (c) The aortic PWV with T2 measured just above the aortic bifurcation was most increased at day 1 and day 3 in prenatal hypoxia‐exposed rat pups but was still increased at week 8 compared to controls (*<.008)
