

Abstract
Aim
The study examined the association of vehicle seating positions with the risk of death in serious motor vehicle crashes (MVCs) in Japan.
Methods
Data from the Japan Trauma Data Bank between 2004 and 2015 were analyzed. All MVC drivers with the legal age for driving and all copassengers were enrolled (n = 23,040). The cases were divided into three groups based on their seating position during the crash: the driver seat, front passenger seat, and rear passenger seats. The primary outcome variable was in‐hospital mortality. Multivariable logistic regression analysis was used to assess the association between the seating position and in‐hospital mortality. Potential factors associated with each seating position and in‐hospital mortality were also assessed.
Results
The odds ratios (ORs) for deaths were estimated for front and rear passengers compared to those for the driver in MVCs. The adjusted ORs (95% confidence interval [CI]) for death were 0.96 (0.84–1.11) and 1.22 (1.04–1.42) for front and rear passengers, respectively. Factors significantly associated with MVC deaths were age over 71 years (OR = 3.38; 95% CI, 2.58–4.41), male gender (OR = 1.54; 95% CI, 1.39–1.71), and night driving (OR = 1.17; 95% CI, 1.06–1.29).
Conclusions
This hospital‐based study suggested that rear seating increased the risk of MVC‐related death. Further studies are needed in order to find mechanisms of the increase in mortality by the seating position.
Keywords: Mortality, motor vehicle crash, seat belt, seating position
We found that the risk of death is higher in rear seat passengers compared to the driver and front copassenger. The risk of mortality was higher in those who were more than 71 years of age, irrespective of the seating position. Only in the driver seat position, the male group or those motor vehicle crashes that occurred at night time had a significantly higher risk of death.
Introduction
Road traffic injuries claim more than 1.35 million lives each year worldwide. Almost 50% of these deaths are due to motor vehicle crashes (MVCs).1 In 2017, the number of road fatalities was 3,694 in Japan.2 In developed countries, a long‐term decreasing trend in the number of fatalities has been observed, while in low‐ and middle‐income countries, particularly in emerging economies where urbanization and motorization accompany rapid economic growth, an increasing trend is seen. Thus, it is not only a public health problem but also a development issue. Therefore, it is important to study the factors associated with these deaths in order to reduce MVC‐related deaths.
Studies so far have shown an association of mortality and severity with the crash mechanisms, speed, the age of injured persons, use of seat belts and child restraints, and the influence of alcohol.1 Although several studies have shown that sitting in the rear seat, as opposed to the front seat, might reduce the risk of passenger death in MVCs,3, 4 others have reported that rear seating is more dangerous,5, 6 thus offering contrasting views. Furthermore, few studies have investigated the impact of factors such as time, the day of the week, and the presence of pre‐existing medical conditions on the prognosis of the passenger.
The aim of this study was to estimate the association between the seating position and the risk of death in MVCs with regards to associated risk factors.
Methods
The Japan Trauma Data Bank (JTDB) is a prospective nationwide hospital‐based registry.7 Using this registry, we estimated the association between seating position and passenger death risk in MVCs, adjusting for the other important factors using multivariable logistic regression. In addition, we also assessed the potential mortality factors associated with each of the seating positions.
Study design, population, and setting
This study was a retrospective analysis of the JTDB database. The study period was from January 2004 to December 2015. The inclusion criteria were all MVC drivers in the legal age for driving (≥18 years), all passengers who were transported to the participating hospital, and those who were registered in the database.
The exclusion criteria were those cases whose age or outcome (death or survival) was unknown.
Japanese Trauma Data Bank
The JTDB was established in 2003 and authorized by the Japanese Association for the Surgery of Trauma (Trauma Surgery Committee) as well as the Japanese Association for Acute Medicine (Committee for Clinical Care Evaluation).8 In 2016, the JTDB consisted of 256 major emergency medical institutions across Japan.9
The JTDB is collected through an online portal from participating institutions. Information on trauma‐related factors, including age, sex, mechanism of injury, pre‐existing medical conditions, the abbreviated injury scale (AIS) code (version 1998), injury severity score (ISS), vital signs on hospital arrival, date, and time course from hospital arrival to discharge, medical treatments such as advanced airway management, red blood cell transfusion within 24 h, and emergency surgical operation, as well as history of mortality at discharge is recorded.7 The ISS is calculated from the top three scores of AIS in nine cites classified by the AIS code. From the JTDB, data on sex, age, pre‐existing medical conditions, time of the day, day of the week, vital signs on hospital arrival, maximum AIS score for each site, ISS, positive Focused Assessment with Sonography for Trauma exam, transport time (time from finding crash to hospital arrival), in‐hospital treatment process, and outcome data were acquired. The primary outcome of this study was in‐hospital mortality, which included patients with cardiac arrest at hospital arrival or those who died after hospital arrival.
All included cases were divided according to their seating position into three groups: driver seat, front passenger, and rear passenger seat. Seating position was defined as: the front passenger seat was next to the driver seat, and the rear seat included all rows of rear seats including the right, middle, and left seating positions.
Statistical analysis
Statistical analyses were undertaken using JMP 14.0 (SAS Institute, Cary, NC, USA). The trend of MVCs according to seating position was evaluated using Fisher's exact test and the Kruskal–Wallis test. The significance of the difference between the three groups was assessed using the χ2‐test for categorical variables, and the Kruskal–Wallis test for continuous variables. As for the primary end‐point, to assess the impact of the seating position on in‐hospital deaths, a multivariable logistic regression model was applied with odds ratio (OR) and 95% confidence interval (CI) as the effect variables.
We selected potential factors considered to be associated with clinical outcomes, including passenger sex, age (categorized as 0–17, 18–30, 31–50, 51–70 and ≥71 years), the number of pre‐existing medical conditions (0, 1, or ≥2), hospital arrival time (daytime, night‐time [18:00–5:59 h]), day of the week (weekday, weekend, or holiday), and the calendar year. We considered the ISS, anatomical severities, or vital signs as intermediate variables between the seating position and passenger in‐hospital death in MVCs. We also undertook subgroup analyses of the potential factors associated with in‐hospital death in each seating position. All tests were two‐tailed, and a P‐value <0.05 was considered statistically significant.
Results
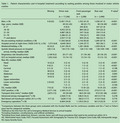
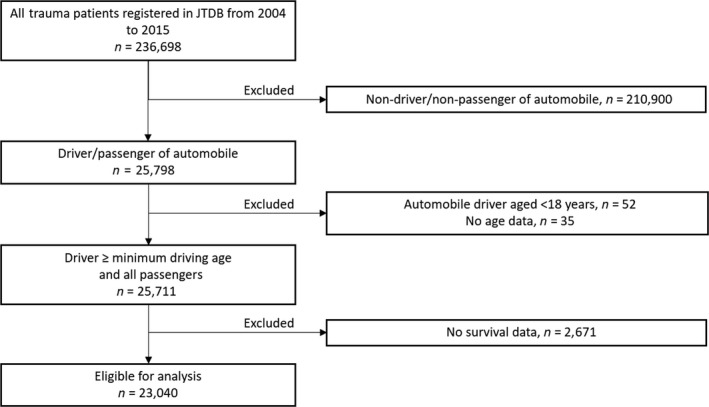
During the study period, a total of 236,698 trauma cases were registered with the JTDB. After excluding non‐drivers or non‐passengers of automobiles, automobile drivers <18 years (the legal age for driving) or unknown age, and patients with no survival data, 23,040 cases (9.7%) were eligible for the final analysis (Fig. 1). Of these, 74.9% of the patients were in the driver seat, 14.3% were in the front passenger seat, and 10.8% were in the rear passenger seat (Table 1).
Figure 1.
Flowchart of patient enrolment. JTDB, Japan Trauma Data Bank.
Table 1.
Patient characteristics and in‐hospital treatment according to seating position among those involved in motor vehicle crashes
| Missing | Driver seat | Front passenger seat | Rear seat | P‐value† | |
|---|---|---|---|---|---|
| (n = 17,246) | (n = 3,298) | (n = 2,496) | |||
| Men, n (%) | 4 (0.02) | 12,851 (74.5) | 1,352 (41.0) | 1,036 (41.5) | <0.001 |
| Age, years; median (IQR) | 49 (32–65) | 48 (23–71) | 38 (18–69) | <0.001 | |
| 0–17 | 0 (0.0) | 293 (8.9) | 547 (21.9) | ||
| 18–30 | 4,052 (23.5) | 864 (26.2) | 554 (22.2) | ||
| 31–50 | 4,887 (28.3) | 547 (16.6) | 334 (13.4) | ||
| 51–70 | 5,380 (31.2) | 750 (22.7) | 495 (19.8) | ||
| 71 and above | 2,927 (17.0) | 844 (25.6) | 566 (22.7) | ||
| No pre‐existing medical condition, n (%) | 11,042 (64.0) | 2,103 (63.8) | 1,695 (67.9) | <0.001 | |
| Hospital arrival at night‐time (18:00–5:59 h), n (%) | 1,573 (6.8) | 6,640 (38.5) | 1,244 (37.7) | 902 (36.1) | 0.130 |
| Weekend/holiday, n (%) | 42 (0.2) | 5,241 (30.4) | 1,281 (38.8) | 1,059 (42.4) | <0.001 |
| Systolic blood pressure on hospital arrival, mmHg; median (IQR) | 330 (1.4) | 130 (110–150) | 128 (110–149) | 128 (109–149) | 0.003 |
| Respiratory rate (breaths/min) | 2,109 (9.2) | 20 (17–25) | 21 (18–26) | 20 (18–25) | <0.001 |
| GCS on hospital arrival, median (IQR) | 1,052 (4.6) | 15 (14–15) | 15 (14–15) | 15 (13–15) | <0.001 |
| Max AIS, median (IQR) | |||||
| Head | 16 (0.2) | 3 (2–4) | 3 (2–4) | 3 (2–4) | <0.001 |
| Face | 9 (0.2) | 1 (1–2) | 1 (1–2) | 1 (1–2) | <0.001 |
| Cervical | 5 (1.3) | 1 (1–1) | 1 (1–1) | 1 (1–2) | 0.198 |
| Chest | 38 (0.3) | 3 (2–4) | 3 (3–4) | 3 (3–4) | <0.001 |
| Abdomen | 44 (0.8) | 3 (2–3) | 3 (2–3) | 2 (2–3) | 0.093 |
| Spine | 18 (0.3) | 2 (2–3) | 2 (2–3) | 2 (2–3) | <0.001 |
| Upper extremities | 0 (0.0) | 2 (1–2) | 2 (1–2) | 2 (1–2) | <0.001 |
| Lower extremities | 2 (0.02) | 2 (1–3) | 2 (1–3) | 3 (2–3) | <0.001 |
| Other | 1 (1–1) | 1 (1–1) | 1 (1–1) | 0.100 | |
| ISS, median (IQR) | 710 (3) | 13 (9–21) | 13 (9–22) | 16 (9–25) | <0.001 |
| FAST positive, n (%) | 3,571 (16) | 2,300 (13.3) | 434.0 (13.2) | 275.0 (11.0) | <0.001 |
| Transport time (min),‡ median (IQR) | 2,873 (12) | 44 (34–60) | 46.0 (34–63) | 47.0 (35–66) | <0.001 |
| Advanced airway management,§ n (%) | 2,928 (17.0) | 538.0 (16.3) | 447.0 (17.9) | 0.278 | |
| Red blood cell transfusion within 24 h, n (%) | 517 (2) | 3,028 (17.6) | 582.0 (17.7) | 413.0 (16.6) | 0.770 |
| Emergency operation,¶ n (%) | 6,004 (34.8) | 1,129.0 (34.2) | 821.0 (32.9) | 0.157 | |
†Comparisons between the three groups were evaluated with the Kruskal–Wallis test for continuous variables and the χ2‐test or Fisher's exact test for categorical variables.
‡Defined as the time from the call to Emergency Medical Services to arrival hospital.
§Including intubation, cricothyrotomy, and artificial ventilation.
¶Including those head, abdominal, thoracic, vascular, bone, and soft tissue procedures that need to be carried out within 24 h.
AIS, Abbreviated Injury Scale; FAST, Focused Assessment with Sonography for Trauma; GCS, Glasgow Coma Scale; IQR, interquartile range; ISS, Injury Severity Score.
Driver seat passengers were more often male (74.5%) compared with other seat passengers. The median age of the driver, front passenger, and rear seat passengers were 49, 48, and 38 years, respectively. Compared to the other groups, the rear seat passenger group had the lowest GCS (on hospital arrival) and highest ISS. There was no difference between the three groups with respect to their need for aggressive treatments, such as advanced airway management, red blood cell transfusion within 24 h, and emergency operation. In terms of the primary outcome, in‐hospital mortality was 9.8% in total: 9.9% in driver seat passengers, 8.8% in front seat passengers, and 10.4% in rear seat passengers.
After adjustment for sex, age categories, pre‐existing medical conditions, year, time of the day, and day of the week, the rear seat group was associated with a higher risk of death compared to the driver seat group; adjusted ORs for death of passengers were 0.96 (95% CI, 0.84–1.11) and 1.22 (95% CI 1.04–1.42) for front and rear passenger seats, respectively (Table 2).
Table 2.
Death from motor vehicle crashes according to driver or passenger seat position
| Total | Death | % | Crude OR | (95% CI) | Adjusted OR | (95% CI) | |
|---|---|---|---|---|---|---|---|
| Driver seat | 17,246 | 1,712 | 9.9 | Reference | Reference† | ||
| Front passenger seat | 3,298 | 289 | 8.8 | 0.87 | (0.76–0.99) | 0.96 | (0.84–1.11) |
| Rear seat | 2,496 | 259 | 10.4 | 1.05 | (0.92–1.21) | 1.22 | (1.04–1.42) |
| All seats | 23,040 | 2,260 | 9.8 |
†Adjusted for seat position, sex, age category, pre‐existing medical condition category, time of the day, day of the week, and year.
CI, confidence interval; OR, odds ratio.
In addition, it was observed that the in‐hospital mortality of each seating position varied with age. Mortality rates were high in older subjects (age >51 years), especially in those older than 71 years, irrespective of the seating position (P < 0.001).
Other factors significantly associated with MVC‐related deaths were male gender (OR = 1.54; 95% CI, 1.39–1.71) and night driving (OR = 1.17; 95% CI, 1.06–1.29). For those in the driver seat position, the MVCs at night‐time or involving men were significantly associated with a higher risk of death: male gender, OR = 1.89 (95% CI, 1.65–2.17); night‐time, OR = 1.19 (95% CI, 1.06–1.33) (P < 0.001). Similar associations in the other seating positions were not statistically significant (Table 3).
Table 3.
Factors associated with in‐hospital death by motor vehicle crashes according to driver or passenger seat position
| All | Driver seat | Front passenger seat | Rear seat | |||||
|---|---|---|---|---|---|---|---|---|
| Adjusted OR | (95% CI) | Adjusted OR | (95% CI) | Adjusted OR | (95% CI) | Adjusted OR | (95% CI) | |
| Age category (years) | ||||||||
| 0–17 | Reference | Reference | Reference | |||||
| 18–30 | 0.75 | (0.58–0.99) | Reference | 0.66 | (0.40–1.08) | 1.08 | (0.69–1.67) | |
| 31–50 | 0.84 | (0.65–1.11) | 1.17 | (1.00–1.38) | 0.69 | (0.40–1.18) | 0.71 | (0.40–1.26) |
| 51–70 | 1.53 | (1.18–1.99) | 2.10 | (1.80–2.45) | 1.01 | (0.61–1.67) | 1.99 | (1.29–2.84) |
| 71– | 3.38 | (2.58–4.41) | 4.31 | (3.63–5.12) | 2.81 | (1.73–4.58) | 4.33 | (2.79–6.72) |
| Sex | ||||||||
| Male | 1.54 | (1.39–1.71) | 1.89 | (1.65–2.17) | 0.97 | (0.74–1.28) | 1.27 | (0.96–1.70) |
| Female | Reference | Reference | Reference | Reference | ||||
| Hospital arrival time | ||||||||
| Daytime | Reference | Reference | Reference | Reference | ||||
| Night‐time | 1.17 | (1.06–1.29) | 1.19 | (1.06–1.33) | 1.08 | (0.81–1.43) | 1.14 | (0.84–1.53) |
| Day of the week | ||||||||
| Weekday | Reference | Reference | Reference | Reference | ||||
| Weekend/holiday | 0.98 | (0.89–1.08) | 0.92 | (0.82–1.03) | 1.19 | (0.92–1.54) | 1.06 | (0.81–1.38) |
| Year | ||||||||
| 2004 | Reference | Reference | Reference | Reference | ||||
| 2005 | 1.05 | (0.78–1.42) | 0.90 | (0.64–1.27) | 2.01 | (0.85–4.72) | 1.29 | (0.46–3.66) |
| 2006 | 0.79 | (0.57–1.08) | 0.78 | (0.55–1.12) | 0.84 | (0.31–2.28) | 0.62 | (0.18–2.08) |
| 2007 | 0.66 | (0.49–0.87) | 0.62 | (0.45–0.86) | 0.74 | (0.31–1.75) | 0.86 | (0.34–2.13) |
| 2008 | 0.65 | 0.48–0.86) | 0.60 | (0.44–0.83) | 0.76 | (0.32–1.81) | 0.88 | (0.35–2.22) |
| 2009 | 0.61 | (0.46–0.81) | 0.57 | (0.42–0.78) | 0.89 | (0.39–2.03) | 0.66 | (0.26–1.65) |
| 2010 | 0.58 | (0.44–0.76) | 0.55 | (0.41–0.75) | 0.63 | (0.27–1.44) | 0.73 | (0.30–1.75) |
| 2011 | 0.43 | (0.33–0.57) | 0.39 | (0.29–0.53) | 0.76 | (0.34–1.70) | 0.43 | (0.18–1.04) |
| 2012 | 0.40 | (0.31–0.52) | 0.36 | (0.27–0.48) | 0.53 | (0.24–1.18) | 0.59 | (0.25–1.37) |
| 2013 | 0.35 | (0.27–0.46) | 0.34 | (0.25–0.46) | 0.33 | (0.15–0.75) | 0.46 | (0.19–1.07) |
| 2014 | 0.38 | (0.29–0.50) | 0.34 | (0.26–0.46) | 0.55 | (0.25–1.21) | 0.56 | (0.24–1.30) |
| 2015 | 0.37 | (0.28–0.49) | 0.34 | (0.25–0.49) | 0.67 | (0.31–1.49 | 0.33 | (0.13–0.82) |
| Pre‐existing medical condition | ||||||||
| 0 | Reference | Reference | Reference | Reference | ||||
| 1 | 0.39 | (0.35–0.45) | 0.40 | (0.35–0.46) | 0.33 | (0.23–0.47) | 0.44 | (0.30–0.64) |
| ≥2 | 0.48 | (0.41–0.56) | 0.50 | (0.42–0.59) | 0.40 | (0.26–0.62) | 0.43 | (0.27–0.68) |
Adjusted for age category, sex, time of the day, the day of the week, year, and pre‐existing medical condition category.
CI, confidence interval; OR, odds ratio.
Discussion
Using the nationwide trauma registry in Japan during 2004–2015, we determined that the risk of MVC‐related death was higher in passengers in the rear seat position compared with those in the driver and front passenger seating positions. The analysis of factors based on seating position showed that the fatality rate of all the seating positions was significantly higher in the group aged 71 years and above. Furthermore, those cases who were in the driver seat had a higher risk of death if they were male, or if the crash occurred during the night.
Previous studies have suggested that the front seat passengers have a higher risk of death than the rear seat passengers.3, 4 In contrast, Japanese statistics10, 11, 12 and some recent studies have shown that the risk of fatality in rear seat passengers is slightly higher than in front seat passengers,5, 6 which is consistent with the results of our study. This difference might be due to the fact that, in recent years, better front seat safety systems such as airbags, seat belts, and load limiters have lowered the risk of death in the front seat.13, 14, 15 However, the exact mechanism of the difference in the results is unclear. Another plausible explanation is the difference in the rate of wearing seat belts by rear seat passengers. The World Health Organization reported that the rates of wearing seat belts are high among both front and rear seat passengers in high‐income countries such as the USA (87% among front seat passengers and 70% among rear seat passengers), the UK (95% among front seat passengers and 88% among rear seat passengers), and Germany (98% among front seat passengers and 97% among rear seat passengers).16 By contrast, the seat belt wearing rate of rear seat passengers in Japan is 38.0% on local roads and 74.2% on expressways, which is lower than the seat belt wearing rates of front seat passengers (95% and more).17
In Japan, the compulsion to wear a seat belt for the front seat passengers started from 1985 on expressways and from 1992 on local roads in Japan. Wearing a seat belt in the rear seat was made mandatory in 2008. Although the effect of wearing a seat belt is considered to be less protective for rear seat passengers compared to front seat passengers, the effectiveness of seat belt use in reducing the severity of the sequelae of motor vehicle occupant injuries and fatalities in MVCs is widely known.18 Thus, it is important to emphasize the need for using seat belts, especially for rear seat passengers.
In terms of factors related to in‐hospital mortality, elderly cases, especially those aged 71 years and older, had higher death rates in all seating positions.
Among those in the driver seat position, crashes that involved men or occurred at night‐time had a higher risk of death. In a previous study, the risk of death in male drivers and while driving at night was observed to be higher, which agrees well with our estimates.19 The mechanism can be explained by the fact that, on average, men travel greater distances by vehicle and tend to have more aggressive and dangerous driving behaviors, including driving under the influence of alcohol and speeding, compared with women.2, 20 With regards to risk of night driving, lack of visibility at night could be associated with MVCs, and night drivers tend to drive for recreation, which includes other potentially risky behaviors such as speeding, drinking alcohol, and consuming drugs.21, 22 Therefore, it is important to educate drivers about these risk factors.
The statistics on road traffic accidents in Japan indicate that, over a period of time from 1966 to 2016, the number of deaths was highest during 1971 (n = 16,765). Although there was a transient increase in 1992, there has since been a steady decline in the number of deaths (n = 3,904) until 2016.11 This reduction might be associated with the comprehensive and effective measures taken by the Japanese government, which include the improvement of roads, automobile safety systems, and safety regulations, such as laws against drinking and driving (established in 1970), against speeding (enforced in 1960), enforcing the use of seat belts (which came into effect in 1985 and 1992 for expressways and local roads, respectively), and against the use of mobile phones while driving, enforced in 1999. The automobile safety system improvements in Japan for wearing seat belts for rear seat passengers will be carried out in 2020, but further continuous observation is warranted. Despite the important findings of the present study, it has several inherent limitations. First, data on factors like driver alcohol or drug use, seat belt use, and the mechanism of injury were not available in this study. Second, this study has the same limitations as those of any other retrospective study: possible bias due to residual confounding factors, and missing data. Finally, this study was based on data from a hospital‐based registry and a comprehensive analysis regarding the epidemiology of MVCs was not undertaken, which might have resulted in a selection bias.
In conclusion, we estimated the association between rear passenger seats and an increase in the risk of MVC‐related deaths. Further studies are needed to determine the mechanisms of mortality in MVCs and the relationship between seating position and mortality, and active countermeasures for safety.
Disclosure
Approval of the research protocol: This study was approved by the ethics committee of Kyoto Prefectural University of Medicine.
Informed consent: N/A.
Registry and the registration no. of the study/trial: ERB‐C‐661.
Animal studies: N/A.
Conflict of interest: None declared.
Funding information
No funding information provided.
References
- 1. World Health Organization . Global status report on road safety 2018. Geneva: World Health Organization, 2018. [Google Scholar]
- 2. National Police Agency . Survey of the number of traffic fatalities in 2017 (29th year of the Heisei period) [cited 25 Dec 2018]. Available from: https://www.npa.go.jp/publications/statistics/koutsuu/toukeihyo.html.
- 3. Berg MD, Cook L, Corneli HM, Vernon DD, Dean JM. Effect of seating position and restraint use on injuries to children in motor vehicle crashes. Pediatrics 2000; 105: 831–5. [DOI] [PubMed] [Google Scholar]
- 4. Smith KM, Cummings P. Passenger seating position and the risk of passenger death in traffic crashes: a matched cohort study. Inj. Prev. 2006; 12: 83–6. [DOI] [PMC free article] [PubMed] [Google Scholar]
- 5. Bilston LE, Du W, Brown J. A matched‐cohort analysis of belted front and rear seat occupants in newer and older model vehicles shows that gains in front occupant safety have outpaced gains for rear seat occupants. Accid. Anal. Prev. 2010; 42: 1974–7. 10.1016/j.aap.2010.06.002. [DOI] [PubMed] [Google Scholar]
- 6. Beck B, Bilston LE, Brown J. Injury patterns of rear seat occupants in frontal impact: an in‐depth crash investigation study. Inj. Prev. 2016; 22: 165–70. [DOI] [PubMed] [Google Scholar]
- 7. Japan Trauma Care and Research . Japan Trauma Databank [cited 25 Dec 2018]. Available from: https://www.jtcr-jatec.org/traumabank/index.htm.
- 8. Yumoto T, Mitsuhashi T, Yamakawa Y et al Impact of Cushing's sign in the prehospital setting on predicting the need for immediate neurosurgical intervention in trauma patients: a nationwide retrospective observational study. Scand. J. Trauma Resusc. Emerg. Med. 2016; 24: 147. [DOI] [PMC free article] [PubMed] [Google Scholar]
- 9. Japan Trauma Care and Research . Japan Trauma Data Bank Annual Report 2011‐2015, 2016. [cited 29 Dec 2018]. Available from: https://www.jtcr-jatec.org/traumabank/dataroom/data/JTDB2016.pdf.
- 10. National Police Agency . Survey of the number of traffic fatalities [cited 25 Dec 2018]. Available from: https://www.npa.go.jp/toukei/koutuu48/toukei.htm.
- 11. Institute for Traffic Accident Research and Data Analysis (ITARDA) . Road safety and traffic accident analysis, 2018. [cited 25 Dec 2018]. Available from: http://www.itarda.or.jp/materials/publications.php?page=4.
- 12. Ministry of Land, Infrastructure, Transport and Tourism . The fatality rate by seat position, 2015. [cited 29 Dec 2018]. Available from: http://www.mlit.go.jp/common/001118302.pdf.
- 13. Sahraei E, Digges K, Marzougui D. Reduced protection for belted occupants in rear seats relative to front seats of new model year vehicles. Ann. Adv. Automot. Med. 2010; 54: 149–58. [PMC free article] [PubMed] [Google Scholar]
- 14. Kent R, Forman J, Parent DP, Kuppa S. Rear seat occupant protection in frontal crashes and its feasibility. 20th Conference on the Enhanced Safety of Vehicles (ECV) 2007; paper NO. 386:1–16; Lyon, France, Jun 2007.
- 15. Esfahani ES, Digges K. Trend of rear occupant protection in frontal crashes over model years of vehicles. SAE World Congress & Exhibition 2009; Detroit, MI, Apr 2009.
- 16. World Health Organization . Seat‐belt wearing rate Data by country [cited 25 Dec 2018]. Available from: http://apps.who.int/gho/data/view.main.51416.
- 17. National Police Agency Traffic Bureau and Japan Automobile Federation . Survey for seat belt wearing rates, 2018. [cited 29 Dec 2018]. Available from: http://www.jaf.or.jp/eco-safety/safety/data/pdf/sb2018.pdf.
- 18. Elvik R, Hoye A, Vaa T, Sorensen M. (eds). The handbook of road safety measures, 2nd edn Bingley, UK: Emerald Group Publishing, 2009. [Google Scholar]
- 19. World Health Organization . Road traffic injuries [cited 25 Dec 2018]. Available from: https://www.who.int/news-room/fact-sheets/detail/road-traffic-injuries.
- 20. Antov D, Banet A, Barbier C et al European road users’ risk perception and mobility, The SARTRE 4 survey. Lyon, France: Public Imprim, 2012. [Google Scholar]
- 21. Chen H, Chen Q, Chen L, Zhang G. Analysis of risk factors affecting driver injury and crash injury with drivers under the influence of alcohol (DUI) and non‐DUI. Traffic Inj. Prev. 2016; 17: 796–802. [DOI] [PubMed] [Google Scholar]
- 22. Preusser DF. Young driver crash risk. Annu. Proc. Assoc. Adv. Automot. Med. 2003; 47: 527–32. [PMC free article] [PubMed] [Google Scholar]