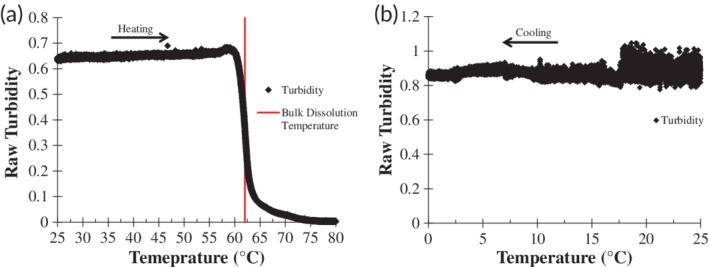
Figure 5.

Characterization of F6‐GPP10 aggregates. (a) Turbidity measurements of F6‐GPP10 aggregates (preformed 24 hr prior to measurement (Figure S25)) during heating and stirring (2.5°C/min and 400 rpm, marked by black diamond data points). A red line marks the point in which dissolution of the aggregates reaches 50% of maximal turbidity and the arrow highlights the directionality in which data was recorded (heating). (b) Continuous monitoring with 400 rpm stirring of F6‐GPP10 aggregate turbidity as a function of cooling from 25 to 0°C with 1°C/min cooling rate. The lack of a drop in turbidity indicates that the F6‐GPP10 aggregates do not possess a T t
