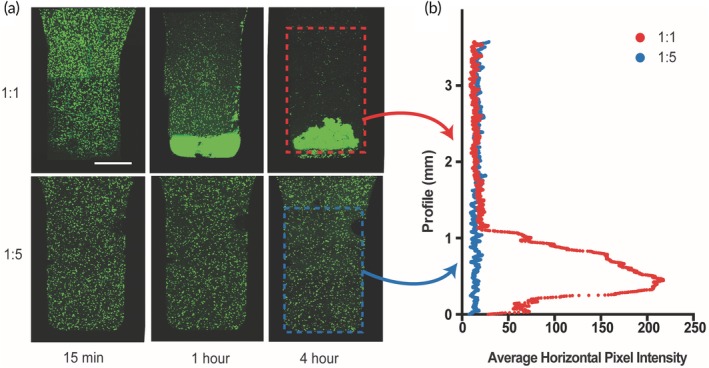
Figure 3.

Cell encapsulation and settling experiments. (a) Cell settling maximum intensity images of calcein‐stained hMSCs encapsulated in 1:1 PNP hydrogel (top row) and 1:5 PNP hydrogel (bottom row) across 4 hr. Scale bar represents 1 mm. (b) Average horizontal pixel intensity of hMSCs along the vertical profile of the hydrogel
