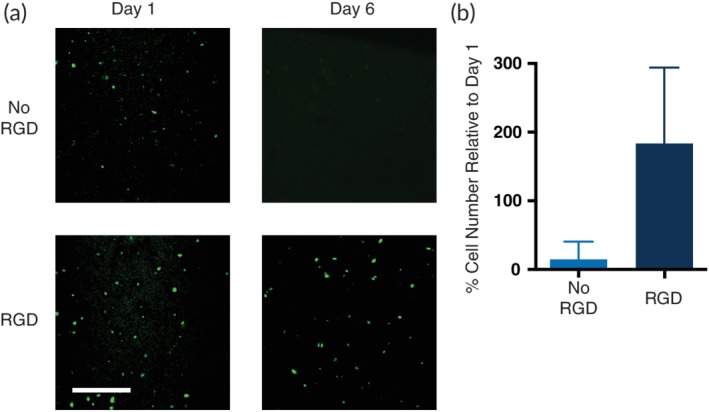
Figure 4.

Cell viability studies in PNP hydrogels. (a) Representative images of viable hMSCs in 1:5 PNP hydrogels with and without the cell adhesive RGD motif attached to the PEG–PLA NPs. PNP hydrogels were calcein stained for 30 min prior to confocal imaging. Scale bar represents 100 μm. (b) Cell viability on Day 6 defined as number of fluorescent cells in the image relative to number of fluorescent cells on Day 1 (data shown as mean ± SD; n = 3)
