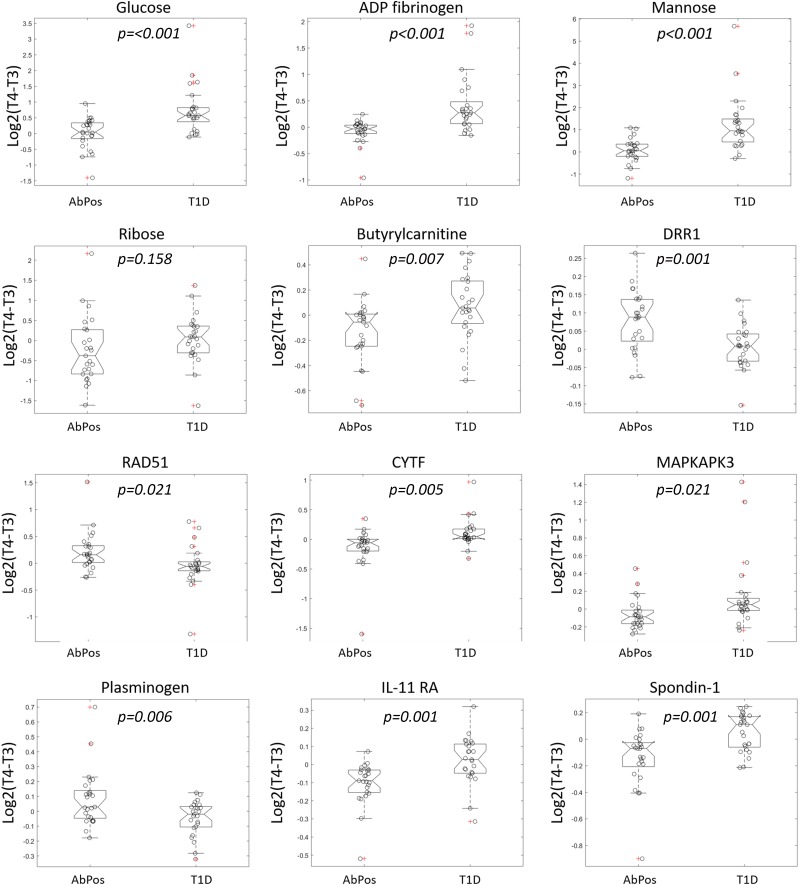
Figure 3.
The top 12 protein, peptide, and metabolite predictors for progression to diabetes. For each analyte, the box plots show log fold change from time 3 (T3) to time 4 (T4) for case and control subjects with individual values noted by circles. The value of log2(T4 − T3) is positive with increasing trajectory and negative with decreasing trajectory.

