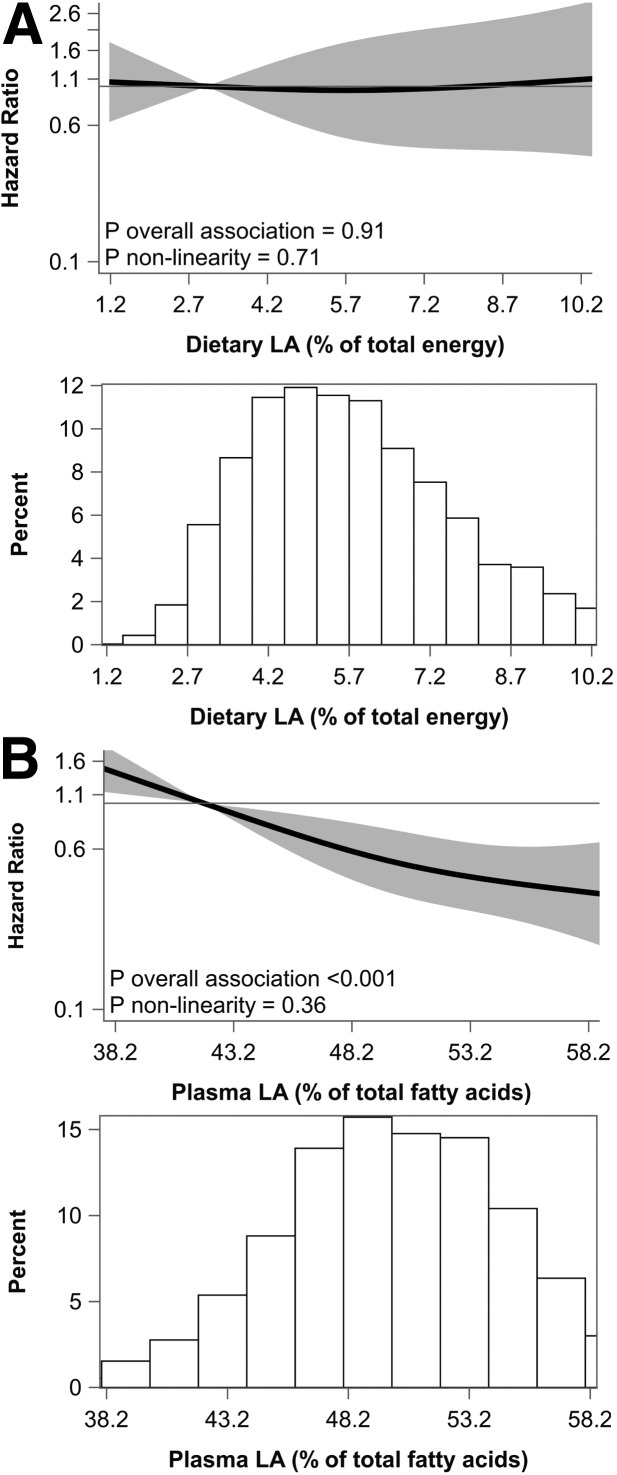
Figure 1.
Associations of dietary LA (replacing SFA + TFA) (A) and plasma LA (B) with incident type 2 diabetes in 3,257 post-MI patients. Solid lines are risk estimates evaluated by restricted cubic splines from Cox models showing the shape of associations on a continuous scale with three knots located at the 5th, 50th, and 95th percentiles. The y-axis shows the multivariable HRs for type 2 diabetes incidence for any dietary or plasma LA value compared with the reference values set at the 5th percentile of dietary LA (3.0% energy) or 5th percentile of plasma LA (41.9%). Gray areas indicate 95% CIs. Results are presented for the fully adjusted models for dietary LA (model 3; adjusted for variables in model 2 [age, sex, Alpha Omega Trial treatment code, physical activity, smoking status, educational level, BMI, family history of type 2 diabetes, total energy intake excluding alcohol, alcohol consumption, dietary fiber, dietary cholesterol] plus dietary protein, carbohydrates, n-3 PUFA, and cis-MUFA) and plasma LA (model 2). Distribution of values of dietary or plasma LA are displayed in a histogram under each spline; % energy, percentage of total energy intake, excluding energy from alcohol.

