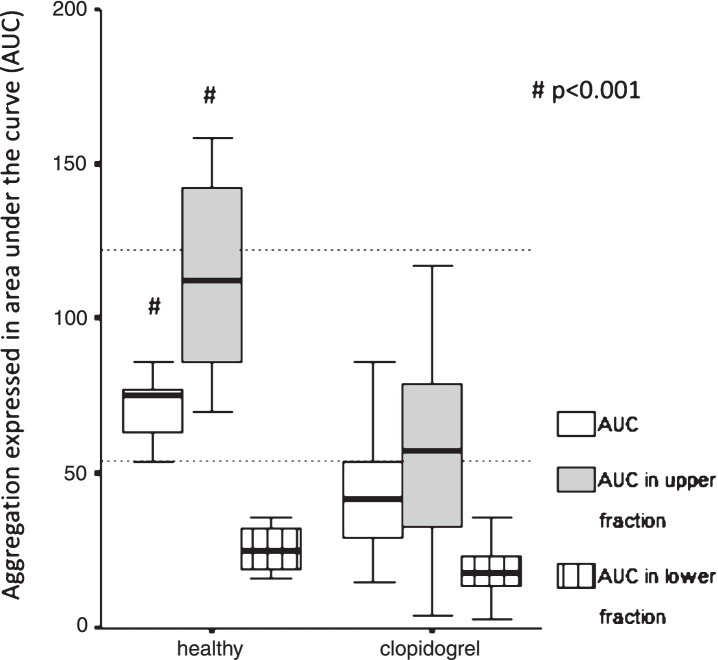
Fig.2.
Platelet function test in healthy subjects and patients taking clopidogrel. Comparison of aggregation expressed as area under the curve (AUC) measured in the whole blood and upper/lower fractions separated after 1 hour gravity sedimentation by Multiplate aggregometry in healthy vs. post-stroke patients taking 75 mg clopidogrel. The two horizontal dotted lines indicate the normal range of AUC as a response to ADP stimulation. Healthy intragroup differences: AUC vs. AUC in upper vs. AUC in lower fraction, p = 0.005 respectively. Clopidogrel intragroup differences: AUC vs. AUC in upper vs. AUC in lower fraction, p < 0.001 respectively. Data are shown as median and 25th–75th percentiles (# indicate intergroup differences p < 0.001 respectively).

