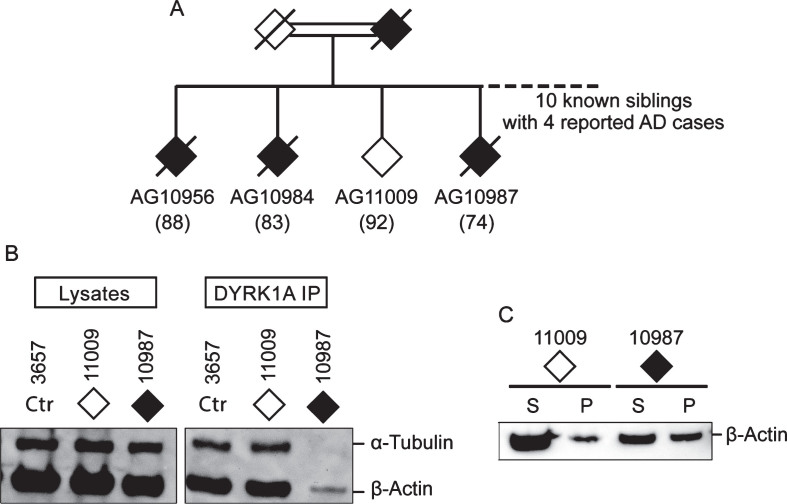
Fig.5.
Comparison of DYRK1A co-IP and G-/F-actin profiles of two siblings from AD family. A) Partial family tree showing parents and four out of ten siblings, of whom four (three are shown) were known to be affected by AD. Solid diamonds denote affected members while the open diamond represents the normal member of the family. Age of sampling is in parentheses. Donors AG11009 and AG10987, together with control 3657, were analyzed by (B) DYRK1A co-IP assay and by (C) G-/F-actin spin-down assay according to protocols described above.

