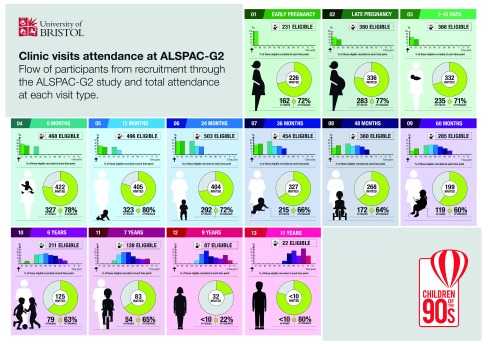
Figure 4. Summary of eligible and invited participants at each assessment time.
Each section in this figure represents one of the ALSPAC-G2 age periods (from early pregnancy to 11 years) at which we currently collect data. In each section, for each assessment we report the number eligible and the composition of that eligible number based on when they were first invited and recruited to the study (bar graph at the top of each assessment period). We also show the total number invited to that assessment and the number and percentage of those invited who attended (central figure). All numbers in this figure refer to invites and recruitment between June 2012 and June 2018.

