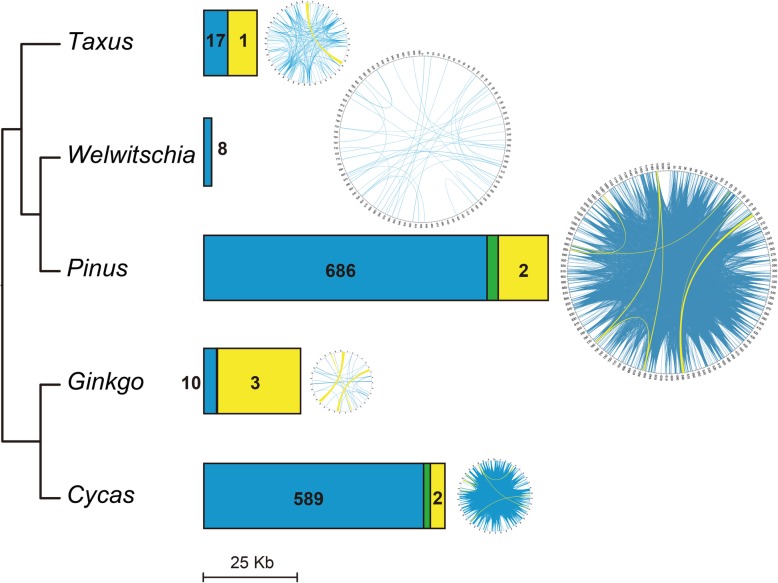
Fig. 7.
Length and distribution of repeats in gymnosperm mitogenomes. The bar shows the length of repeats, and the map shows the distributions of repeats. Yellow and blue represent large (> 1000 bp) and medium-sized (100–1000 bp) repeats, respectively, and green indicates the length of overlapping regions between large and medium-sized repeats

