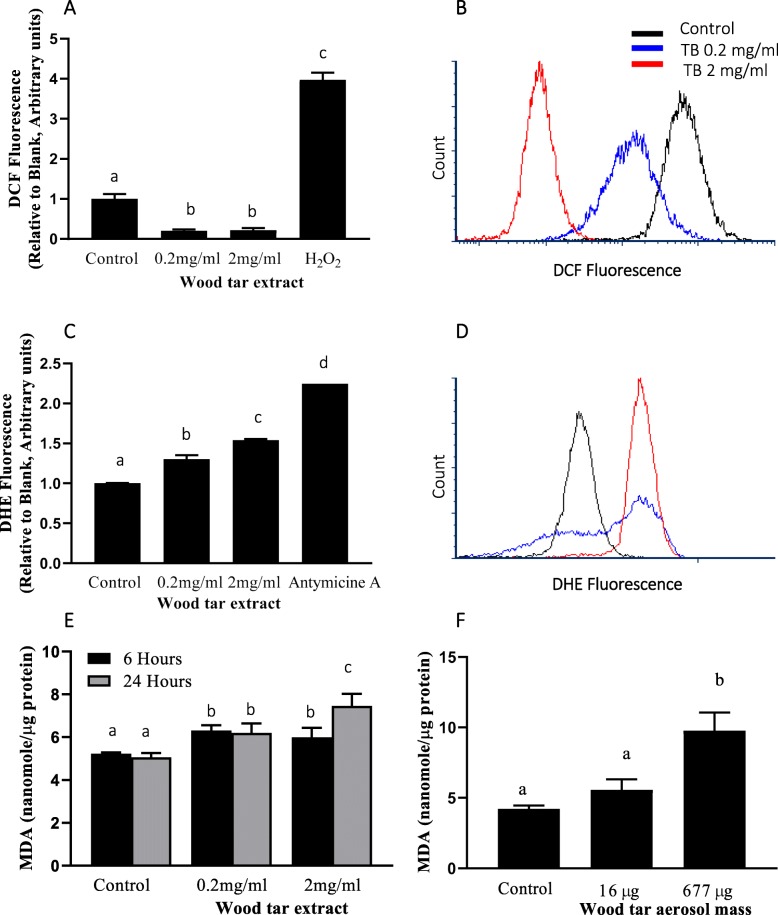
Fig. 3.
Oxidative stress after exposure to wood tar extracts. a Intracellular ROS were measured using H2DCF-DA, and detection was performed by flow cytometry (ZE5 Cell Analyzer, Bio-Rad). b Flow cytometry histogram for DCF fluorescence. c Superoxide anions were measured using DHE, and detection was performed by flow cytometry (ZE5 Cell Analyzer, Bio-Rad). d Flow cytometry histogram for DHE fluorescence. Lipid oxidation was measured in e cells exposed to wood tar suspension and f mice exposed to wood tar solution as described in the methods section. The data are expressed as the mean ± SD. Means marked with different letters are significantly different from each other at p < 0.05

