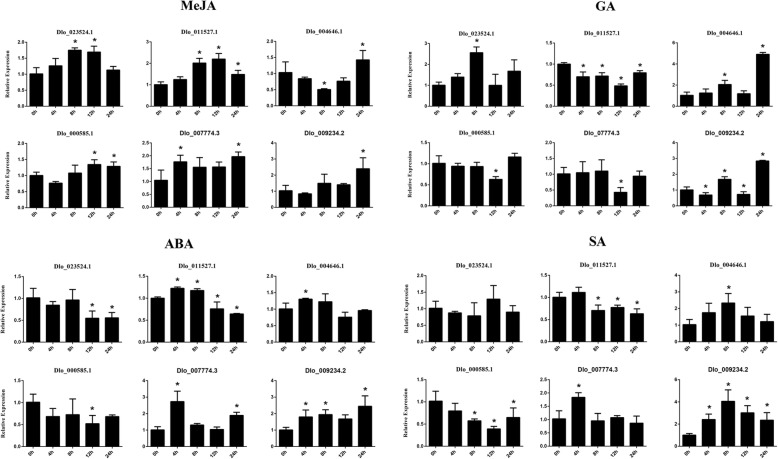
Fig. 10.
Expression analysis of six selected DlAP2/ERF genes respond to four hormone treatments by qRT-PCR. Data were normalized to EF1α and ACTB gene and vertical bars indicate standard deviation. Asterisks indicate the corresponding gene significantly up- or down-regulated compared with the untreated control (*P < 0.05)

