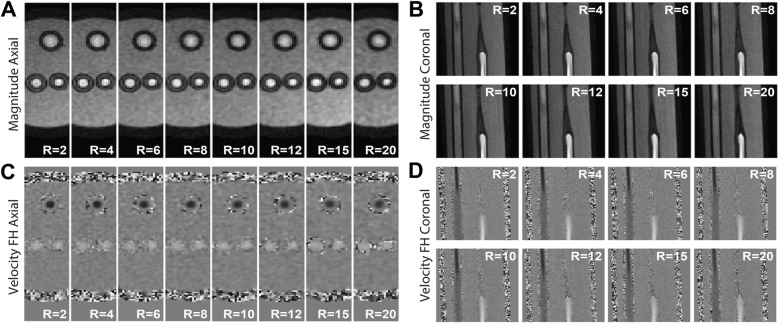
Fig. 4.
Axial (a) and coronal (b) view of magnitude images of the phantom for R = 2–20. Axial (c) and coronal (d) view of velocity images for R = 2–20. Both velocity images show feet-head (FH) flow encoding with a velocity range of − 150 to 150 cm/s. In axial images the backflow tube is on the top and the bifurcation tube on the bottom. In coronal images, the backflow is on the left and the bifurcation tube on the right

