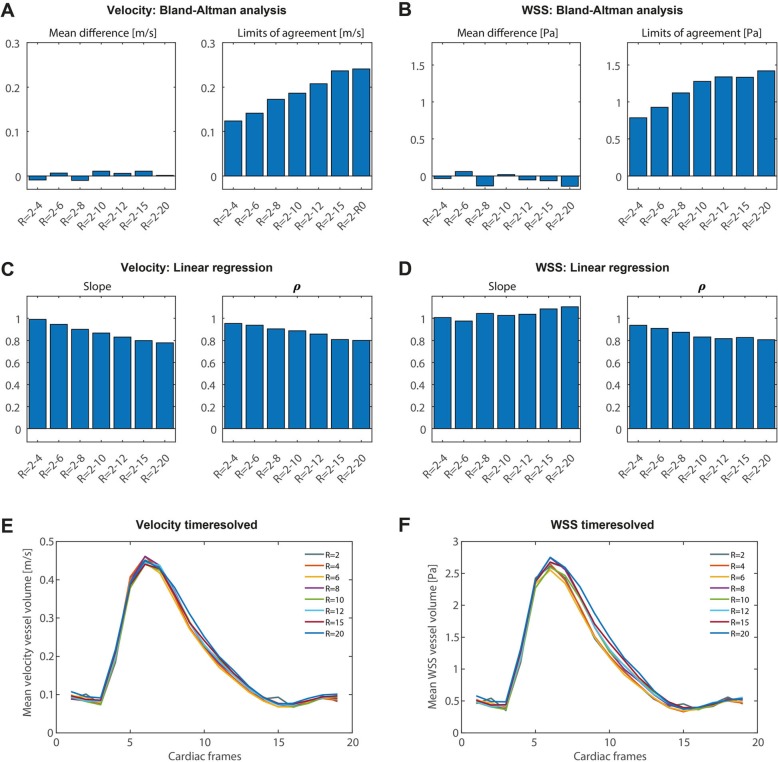
Fig. 7.
a Comparison of peak systolic WSS values at R = 2 with all higher acceleration factors R = 4–20 using Bland-Altman analysis (mean differences and limits of agreement (LOA)). b The same comparison as in (a) for velocities at peak systole. c Comparison of peak systolic WSS values at R = 2 with all higher acceleration factors R = 4–20 using orthogonal regression (slope of the regression line and Pearson correlation coefficient ρ). d The same comparison as in (c) for velocities at peak systole. e-f Mean WSS and mean velocity (calculated per time point and over the vessel volume), plotted for all cardiac frames

