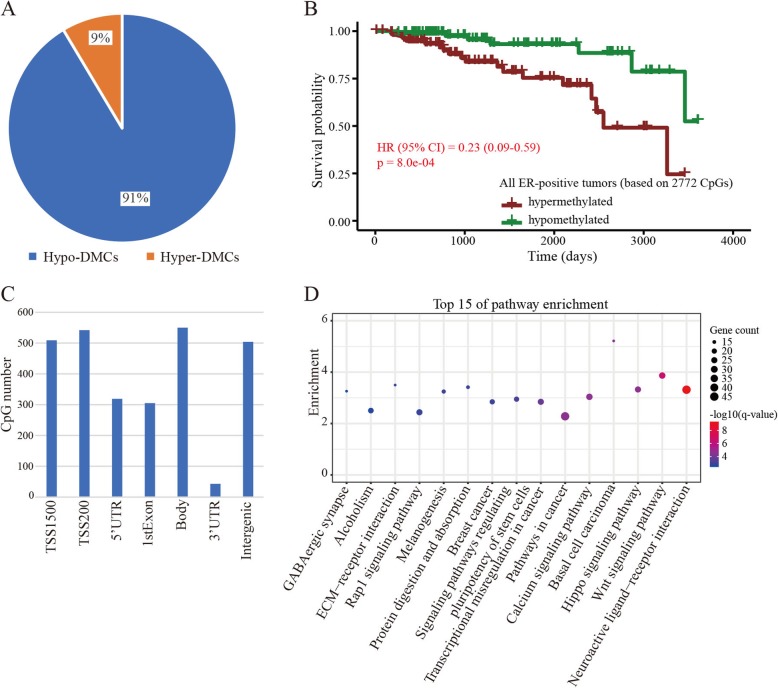
Fig. 4.
CpG sites with methylation differences between the two ER-positive BRCA subgroups. a Percentage of hypermethylated and hypomethylated sites between hypo-ER-positive and hyper-ER-positive cancer subgroups. b Survival curve in the two subgroups based on the methylation level of the 2772 hypo-DMCs. c Distribution of hypo-DMCs in various genomic sequences. d Genes with hypo-DMCs enriched in pathways related with cancer

