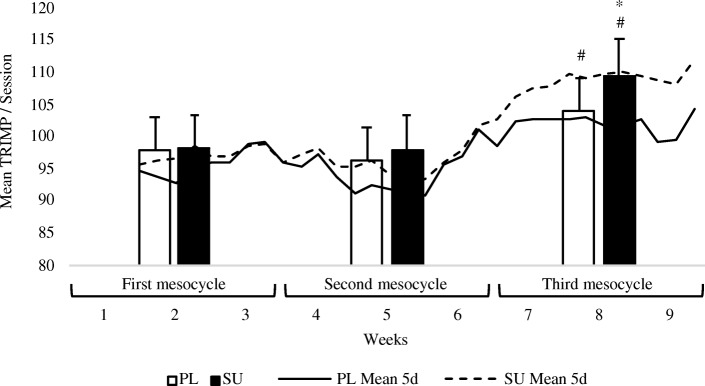
Fig. 6.
Training loads in the PL and SU groups as a function of mesocycles and training progression. Bars represent the mean training impulse (TRIMP) associated with the corresponding mesocycle in the PL (white columns) and SU (black columns) groups (standard deviations are reported). Mesocycles and weeks are reported on the x axis. Dashed lines (SU) and solid lines (PL) were obtained using a 5-day moving average. * p < 0.05 as compared to PL; # p < 0.05 as compared to an earlier time point

