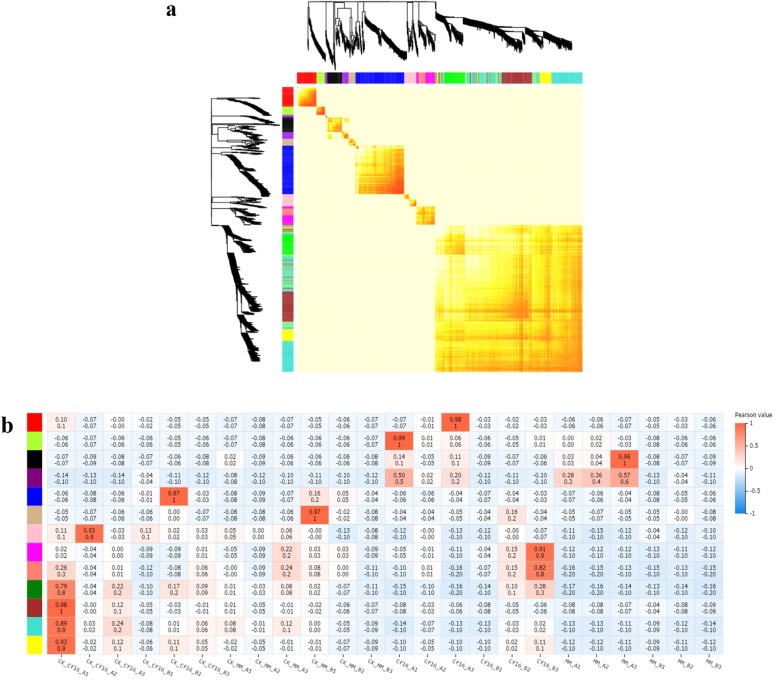
Fig. 7.
Gene co-expression network analysis by WGCNA. a Gene dendrogram colored according to correlations between gene expression levels. Different colors represent different gene modules and indicate coefficients of dissimilarity between genes. b Module-sample association. The abscissa represents the samples; the ordinate represents the modules. The numbers in each cell are the correlation coefficient (top) and P-value (bottom). The variation from blue (low) to orange (high) indicates the ranges of the DEGs

