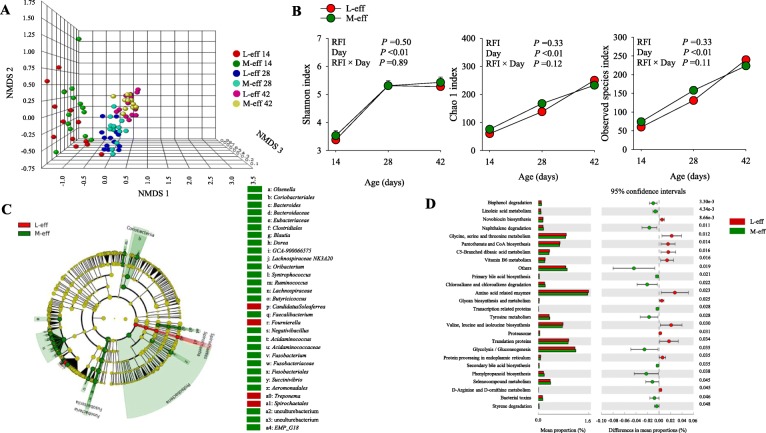
Fig. 4.
Hindgut microbiome during the preweaning period in least-efficient (L-eff, n = 13) or most-efficient (M-eff, n = 13) heifer calves. a Non-metric multidimensional scaling (NMDS) plot of fecal microbiome profiles. b Alpha diversity indices. c Cladogram of LEfSe analysis showing overrepresented microbial populations. Taxa were significant when assessed by LeFSe (P ≤ 0.05 and LDA cutoff > 3.0). d Microbial functional predictions revealed the most differentially regulated metabolic pathways in the fecal microbiome at KEGG levels 3 (i.e. Environmental Information Processing)

