
Fig. 6.
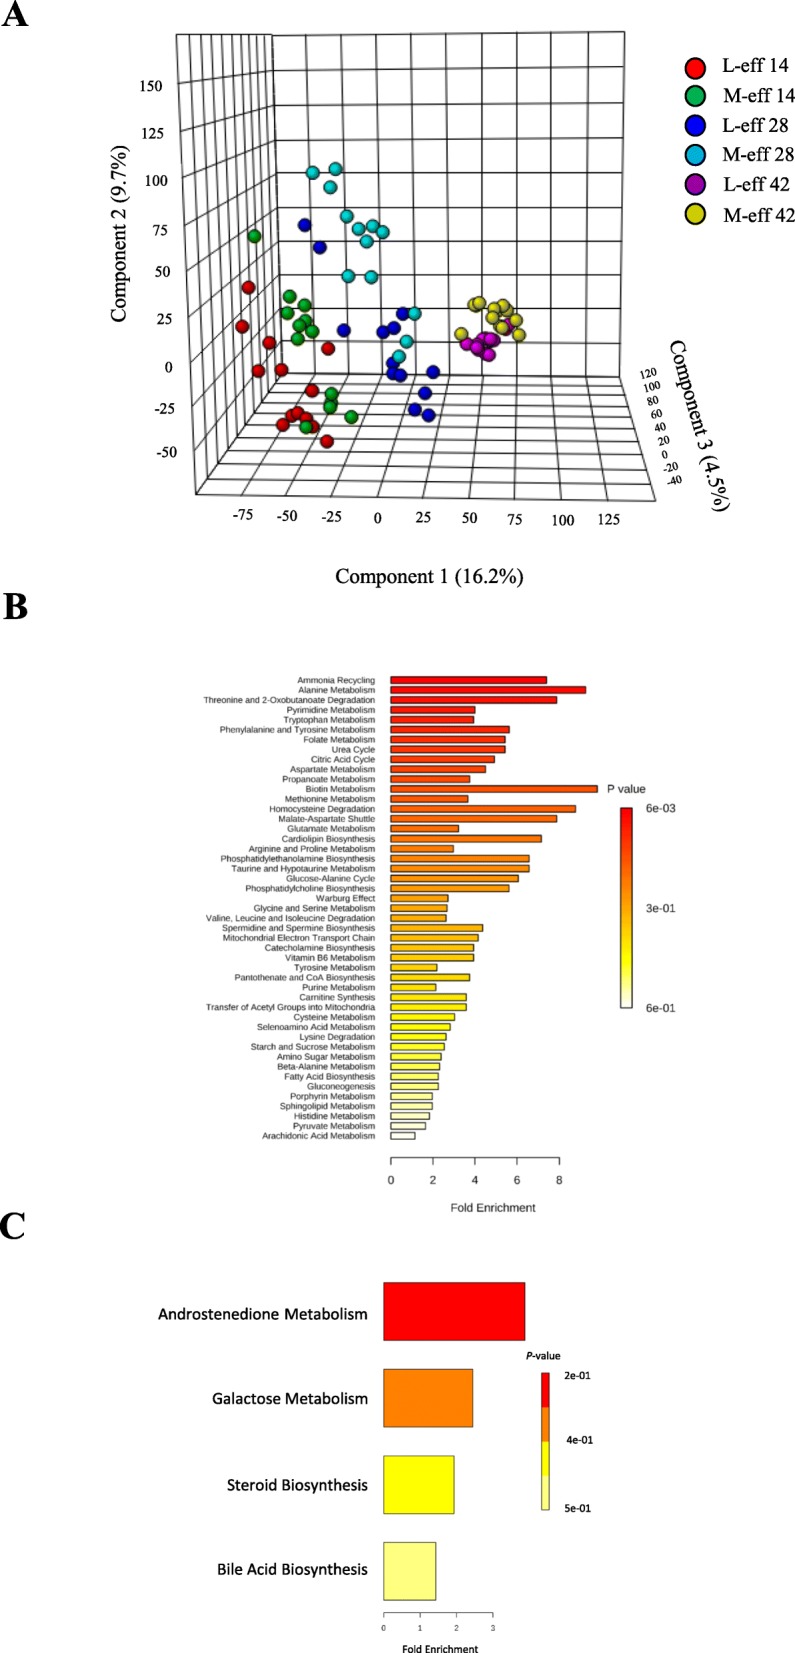
Hindgut metabolome profiles during the preweaning period in least-efficient (L-eff, n = 13) or most-efficient (M-eff, n = 13) heifer calves. a 3D scores plot of partial least square discriminant analysis (PLS-DA). b and c Upregulated and downregulated metabolic pathways in M-eff heifer calves at birth