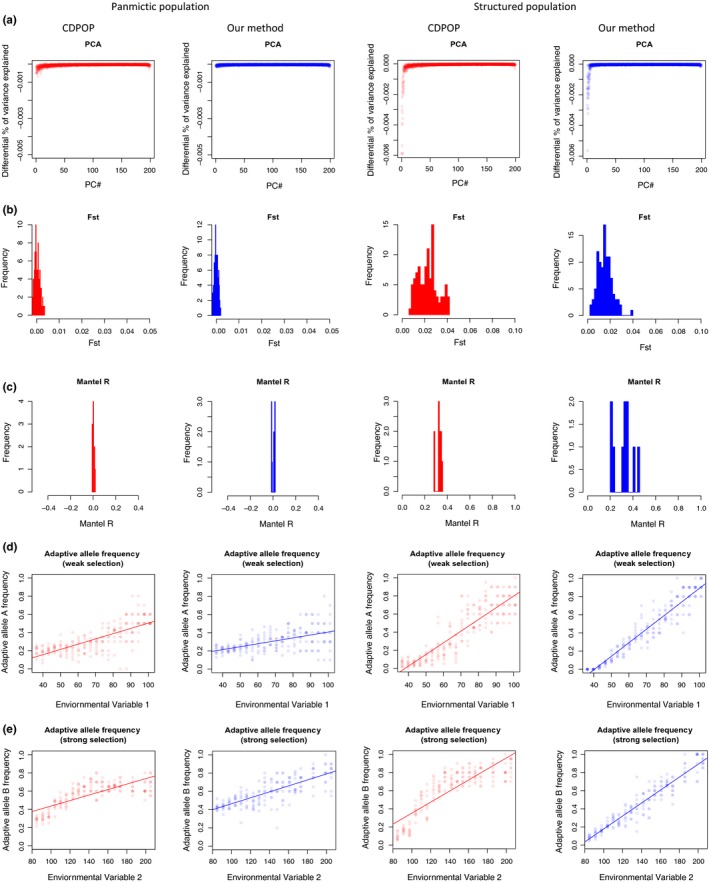
Figure 2.

Comparison of genotypes simulated with cdpop and our method. Two distinct demographic scenarios were conceived, one with random mating (panmictic population) and one with dispersal costs related to distance (structured population). For each of them, cdpop simulated the evolution of the population over 100 generations (red graphs) and replicated the same scenario 10 times. Simultaneously, we replicated the same scenarios using our simulative approach and show here the closest match (also replicated 10 times) to cdpop simulations (blue graphs). Five methods for evaluating the genetic makeup are presented. (a) A principal component analysis is applied to the genotype matrix and the differential of the percentage of explained variation by each component is plotted for every replicate. (b) Pairwise F ST analysis between five subpopulations is performed for every replicate and the resulting distribution of F ST is shown. (c) Mantel correlation is calculated between a matrix of genetic and of geographical distances. The resulting Mantel R for every replicate is shown(d, e) The allelic frequency of adaptive genotypes is shown as a function of the environmental variables causing selection (representing a case of moderate and strong selection, respectively)
